• Skip to primary navigation
  • Skip to content
  • Skip to primary sidebar
  • Skip to secondary sidebar

CORE Robotics Lab

  • Home
  • Publications
  • People
  • Robots
  • Blog
  • Contact Us

Matthew Gombolay

Bootcamp Summer 2020 Week 8 – Karush-Kuhn-Tucker (KKT) conditions

August 30, 2023 by Nakul Gopalan, Zac Chen and Matthew Gombolay

Introduction

To solve any machine learning problem we need three ingredients: some data observed in the world, a model to explain our data, and an optimizer that can fit the model to the data. In this blog we re-visit the optimization problem, which we first explained in the Gradient Descent post. We present the problem of constrained optimization and explain the conditions required to achieve an optimal solution when solving constrained optimization problems.

Humans approximately solve constrained optimization problems frequently. For example, if someone wants to find a way to get to the city as quickly as possible without paying highway tolls, that person would be solving a constrained optimization problem. Specifically, the objective is to get to the city as quickly as possible, and the constraint is to not use any roads or highways that might require the person to pay tolls. Such problems are commonplace and require a search over all solutions to verify that the solution is optimal and does not violate any of the constraints. From a computational perspective these constrained optimization problems are NP-hard.
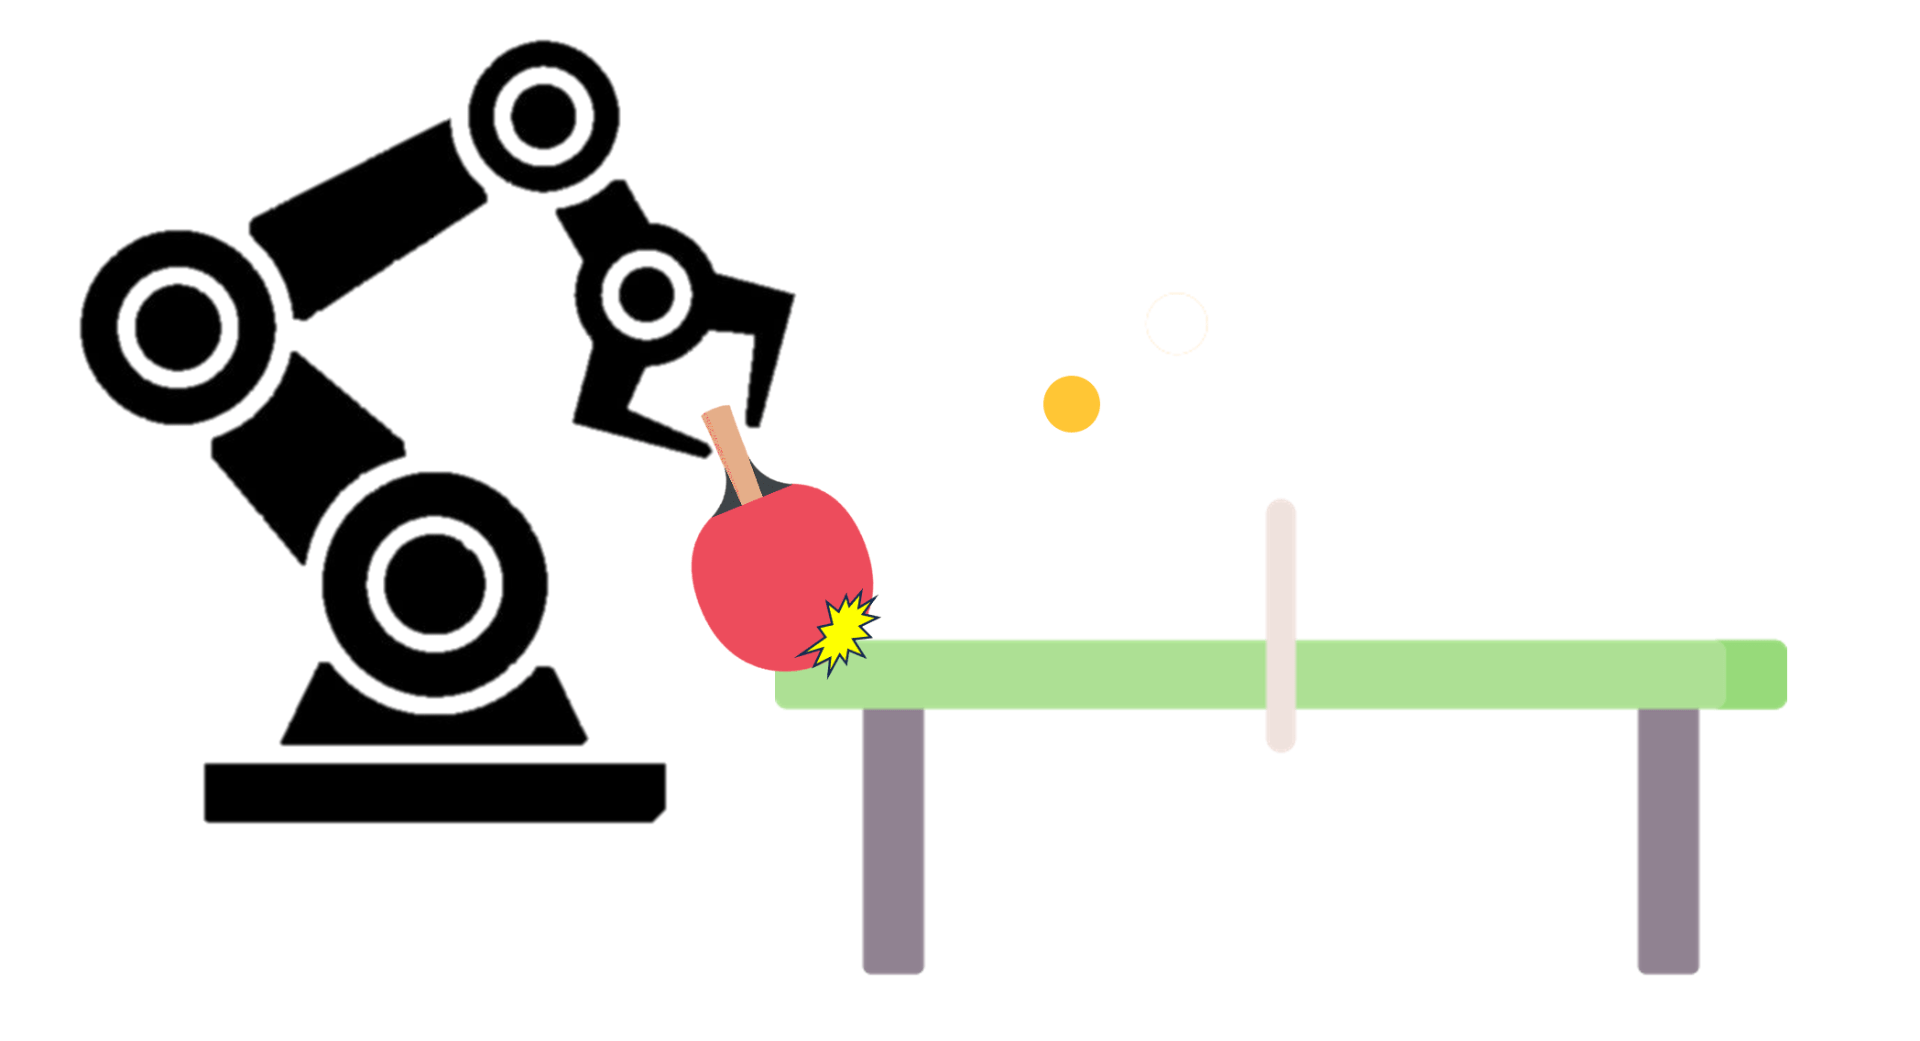
When a robot is attempting to learn to play table tennis, there might be other constraints in the optimization problem, such as not hitting the table. If the learning is done without putting such constraints in, the robot can hit the table during learning, as shown above, which would be disastrous to the robot.

These problems are also present in robot learning. Consider a robot learning to hit a table-tennis ball from demonstrations (Figure 1). We can collect demonstration data of a human moving the robot’s arm through the motion of a table tennis stroke. We might then have a supervised learning model to learn the task by minimizing the distance between the demonstrated and learned robot trajectories. However, there are also several possible constraints to this learning problem. First is a constraint of physics, such as the robot’s forward dynamics model. The forward dynamics model for a robot specifies how much its joints can move under a given force. These can be thought of as equality constraints, $\tau = H(q)\ddot{q}$, where a given torque, $\tau$, specifies the amount a robot joint can move via a joint-space inertia matrix, $H$, whose variables are the robot’s joint angles $q$. Other specific constraints might be that the robot needs to learn these trajectories safely, for example, the robot should never hit the table while playing (Figure 1). This could be done by creating a box around the table and telling the robot to never enter the box. Such a constraint might be an inequality constraint, i.e., $x < 10$, where $x$ is the robot's end-effector position along the $x$-coordinate and at $10m$ might be the edge of the table w.r.t. to the origin of the robot's coordinate frame. Hence the learning problem can have both equality and inequality constraints. Such an optimization problem can be specified as: \begin{alignat*}{3} & \text{minimize}& f(\mathbf{x})\\ & \text{subject to} \quad& h_j(\mathbf{x}) = 0, \forall j\\ & \quad& l_i(\mathbf{x}) \leq 0, \forall i, \label{eq:constrained_optimization} \end{alignat*} where the constraints for the robot's dynamics ($h_j$) and physical space ($l_i$) are specified and the goal would be minimize a loss function for the supervised scenario where the robot generates a table-tennis trajectory similar to the human's demonstration.

Equality Constraints in a learning problem

Contour lines for the two variable optimization goal function $f(\mathbf{x})$ and the equality constraint $h(\mathbf{x})$. The optimal values for $x_1, x_2$ are locations where the constraint curve is tangent to the contour, i.e., the gradient, w.r.t. vector $\mathbf{x}$, of the constraint is parallel to the gradient, w.r.t. $\mathbf{x}$, of the function to be optimized. This is a necessary condition, which helps formulate the Lagrangian multiplier formulation of the optimization problem. Image inspired from Nexcis, Public domain, via Wikimedia Commons.

We first examine the solution to the constrained optimization problem considering only equality constraints. Consider the problem of form:
\begin{alignat}{3}
& \text{minimize} \quad f(x_1,x_2) \nonumber \\
& \text{subject to} \quad h_0(x_1,x_2) = c \quad .
\end{alignat}

In this example vector $\mathbf{x} = [x_1,x_2]$, and there is only one constraint $h_0$. Figure 2 provides an example function $f(\mathbf{x})$, and its equality constraint $h(\mathbf{x})$. Notice that the optimal point for the function under the constraint is a point where the constraint function is tangent to the isoline with value $d_1$. This is because moving along the equality constraint does not make the values of the function $f(\mathbf{x})$ increase in either direction, meaning that this is a stationary point. An optimal value of the function under constraints can only exist on such stationary points. This stationarity condition is a necessary condition for optimality. Further, the gradient of the function is parallel to the gradient of the equality constraint, as the two curves, i.e, the optimization function and constraint, are tangent at these stationary points. If the two curves are tangent, their gradients vectors differ only by a scalar, i.e., $\nabla f = \lambda \nabla h$. This property is shown in Figure 2 more clearly.

The Lagrangian function can then be defined as:
\begin{equation}
\mathcal{L}(\mathbf{x},\lambda) = f(\mathbf{x}) + \lambda h(\mathbf{x}),
\end{equation}
where the necessary, but not sufficient, condition for optimality is $\nabla_{\mathbf{x}, \lambda} \mathcal{L}(\mathbf{x}, \lambda) = 0$. We can now use gradient descent to find a locally optimal solution for the Lagrangian function, which will provide us with solution for both, the parameter $\lambda$, and values for the vector $\mathbf{x}$ for the locally optimal solution. If the two functions, $f$ and $h$ are convex, then the solution will be a globally optimal solution. This technique of converting a constrained optimization problem into the new function where the constraints are summed is called the Lagrange multipliers technique. The Lagrange multipliers technique hence allows us to use gradient descent to solve a constrained optimization problem, which allows for a computationally feasible way to solve these problems, without the use of matrix inversions.

Inequality constraints in the optimization problem

To solve constrained optimization problems with inequality constraints, we again use Lagrangian multipliers. Consider the following constrained optimization problem:
\begin{alignat}{3}
& \text{minimize}& f(\mathbf{x}) \nonumber \\
& \text{subject to} \quad& h_j(\mathbf{x}) = 0, \forall j \nonumber \\
& \quad& l_i(\mathbf{x}) \leq 0, \forall i
\end{alignat}
This is the primal problem, where we are minimizing the function w.r.t. to the input variable $\mathbf{x}$. However, a dual problem can be formulated, which is maximized w.r.t. to the constraint variables. Sometimes the dual problem might make the primal problem computationally tractable, or vice versa, because the evaluation in one of the forms for the function being computed might be easier.

A dual problem changes the variables of the optimization problem and the direction of the optimization from a minimization problem to a maximization problem. The value of the primal and the dual problem at the optimal solution are equal, where the minimization problem provides the upper bound, and the maximization problem, i.e., the dual, presents the lower bound for the values of the primal problem.
We formulate the dual with the Lagrangian:
\begin{equation}
\mathcal{L}(\mathbf{x},\mathbf{\lambda},\mathbf{\alpha}) = f(\mathbf{x}) + \sum_j \lambda_j h_j(\mathbf{x}), + \sum_i \alpha_j l_i(\mathbf{x}).
\end{equation}
The dual function using this Lagrangian would be:
\begin{equation}
g(\mathbf{\lambda},\mathbf{\alpha}) = \textrm{min}_x \mathcal{L}(\mathbf{x},\mathbf{\lambda},\mathbf{\alpha}),
\end{equation}
and the dual optimization problem would be:
\begin{alignat}{3}
\lambda^*\!, \alpha^* =& \text{argmax}_{\mathbf{\lambda}, \mathbf{\alpha}} g(\mathbf{\lambda}, \mathbf{\alpha}) \nonumber \\
& \alpha_i \geq 0, \forall i .
\label{eq:dual_prob}
\end{alignat}

To find the optimal solution for the constrained optimization problem we need to find values of $\mathbf{x},\mathbf{\lambda},\mathbf{\alpha}$ at which the Lagrangian is stationary, and both the primal and dual problems are satisfied without any constraint violations. We use gradient descent iteratively to solve this problem:

[Step 1] Find the optimal value of $\mathbf{x}$ under which the Lagrangian is minimized, i.e, $\mathbf{x}* = \textrm{argmin}_{\mathbf{x}} \mathcal{L}(\mathbf{x},\mathbf{\lambda},\mathbf{\alpha})$. We pick the values for $\mathbf{\lambda}$ and $\mathbf{\alpha}$ at random for the first iteration.

[Step 2] Holding the optimal value of $\mathbf{x}*$ found previously, we now find the gradient of $\mathcal{L}$ w.r.t. $\mathbf{\lambda}$ and $\mathbf{\alpha}$, and update their values with a learning rate to perform gradient ascent. This is akin to moving slowly towards the optimal solution of the dual problem defined in Eq. \ref{eq:dual_prob}.

We iterate over both these steps until we reach the stopping conditions, which are called the Karush–Kuhn–Tucker (KKT) conditions for optimality. These conditions are:

  1. Stationarity: The gradient of the Lagrangian is zero as explained in the previous section, i.e., $\nabla \mathcal{L} = 0$.
  2. Primal feasiblity: The constraints of the primal problem are satisfied, i.e., $h_j(\mathbf{x}) = 0, \forall j,$ and $l_i(\mathbf{x}) \leq 0, \forall i$.
  3. Dual feasiblity: The constraints of the dual problem are satisfied, i.e., $\alpha_i \geq 0, \forall i$.
  4. Complimentary Slackness: $\sum_i \alpha_j l_i(\mathbf{x}) = 0$. This ensures that either the inequality constraints in the primal are satisfied by equality, i.e., are tight, and $\alpha_i$ is unbounded, or $\alpha_i = 0$, and the constraint has a lot more slack in satisfiability.

The KKT conditions provide the necessary conditions for local optimality for a constrained optimization problem with inequality constraints. These conditions were developed as a generalization to the Lagrange Multipliers technique that account for both equality and inequality constraints. The Lagrange multipliers technique developed in the previous section is a technique only applicable to equality constraints.

We can compute the solution of the primal and the dual at each iteration of the optimization problem, and also compute the optimality gap: $\frac{p^k-d^k}{d^k}$, where $p^k$ and $d^k$ are the values of the primal and dual problems in iteration $k$ of the optimization. Here the solution of the minimization primal problem provides the upper bound of the function value and the solution of the dual provides the lower bound of the function value, which converge towards each other asymptotically over optimization iterations. The optimality gap provides a range within which the optimal constrained solution lies and gives us an upper and lower bound over our solution quality.

Key Takeaways

  1. Constrained optimization is an important and computationally challenging problem needed for robot and machine learning.
  2. Given a constrained optimization problem, a Lagrangian can be formulated where the constraints are used as additive factors to the optimization function. The stationary points of the Lagrangian are candidates for the optimal solution of the optimization problem.
  3. The Lagrange multipliers technique allows us to use gradient descent to solve a constrained optimization problem, which allows for a computationally feasible way to solve these problems by avoiding matrix inversions. These solution methods take a different form to solve approximately for non-convex problems which are generally faster.
  4. Karush–Kuhn–Tucker (KKT) conditions provide the necessary conditions for local optimality for a constrained optimization problem with inequality constraints. These conditions were developed as a generalization to the Lagrange Multipliers technique.
Filed Under: Bootcamp

Bootcamp Summer 2023 Week 1 – Projected & Mirror Gradient Descent

July 30, 2023 by Byeolyi Han, Arthur Scaquetti do Nascimento, Rohan Paleja and Matthew Gombolay


Gradient descent is an ubiquitous optimization algorithm used to train machine learning (ML) algorithms from simple linear regression models to sophisticated transformer architectures. ML researchers are typically introduced to unconstrained optimization problems (e.g., least-squares, LASSO, or Ridge regression). However, many really-world ML problems are constrained optimization problems. For example, in robotics, we may want to train a robot for maneuvering around a crowd by imitating human motion (e.g., Behavior Cloning where the robot minimizes the divergence between the distribution of actions the robot takes and that the human would take in the same state of the world, $x$) subject to the constraint that the robot will never crash into a person.

In this blog post, we will look at some powerful approaches for performing constrained optimization. First, we quickly recap the concept of gradient descent. Next, we’ll delve into Projected Gradient Descent, a technique that introduces constraints to the optimization process. Finally, we’ll uncover the magical world of Mirror Gradient Descent, a method that combines the power of duality and optimization. For an example of how Mirror Gradient Descent has been used, check out these papers:

  • Montgomery, W.H. and Levine, S., 2016. Guided policy search via approximate mirror descent. Advances in Neural Information Processing Systems, 29.
  • Zhang, M., Geng, X., Bruce, J., Caluwaerts, K., Vespignani, M., SunSpiral, V., Abbeel, P. and Levine, S., 2017, May. Deep reinforcement learning for tensegrity robot locomotion. In 2017 IEEE international conference on robotics and automation (ICRA) (pp. 634-641). IEEE.
  • Cheng, C.A., Yan, X., Wagener, N. and Boots, B., 2018. Fast policy learning through imitation and reinforcement. arXiv preprint arXiv:1805.10413.

Recap: Gradient descent
Imagine we are trying to train a neural network with a parameter \(\theta\). Given \(\theta\), the neural network produces the prediction \(f(\theta)\). We have a cost function \(\mathcal{L}(\theta)\). Our goal is to find the optimal parameter $\theta^*$ that minimizes \(\mathcal{L}(\theta)\). Let’s consider the standard \(L^2\)-norm loss function with respect to our dataset \(D\), defined as follows:
\[\mathcal{L}(\theta) = \Sigma_{(x,y) \in D} \frac{1}{2} ||y-f_\theta (x)||^2 .\]

Starting from an initial point \(\theta_0\), Gradient Descent performs the following update at every timestep:
\[\theta_{t+1} \leftarrow \theta_t -\alpha \nabla_\theta \mathcal{L}(\theta_t).\]

Note that we are going opposite to the gradient direction (minus sign in the gradient) since we are “minimizing” the loss function. When the dataset is too large to compute the gradient at every timestep, we use Stochastic Gradient Descent which computes the gradient with respect to a single example, or Mini-batch Gradient Descent which computes the gradient with respect to a small batch sampled from the dataset at every timestep.

For more information such as time complexity and convergence rate, please refer to our previous blog post: Bootcamp Summer 2020 Week 1 – Gradient Descent.

Constrained Optimization Problem
In many real-world scenarios, optimization problems are often attached to certain constraints or boundaries that resulting parameters must satisfy. These constraints can represent physical limitations, practical considerations, or desired properties of the solutions. For example, consider a manufacturing company that produces various products. The company aims to maximize the overall utility derived from these products, taking into account factors such as customer demand, quality, and profitability. However, the company faces a budget constraint, which limits the total amount of money available for production.

To formulate this as a constrained optimization problem, let’s first define the following variables:
$x_1, \cdots, x_n$: The quantities of each product to be manufactured.
$U(x_1, \cdots, x_n)$: The utility function that quantifies the overall satisfaction derived from the products.
$c_1, \cdots, c_n$: The respective costs of producing each product.

The objective is to maximize $U(x_1, x_2, \cdots, x_n)$ while satisfying the constraint of the total budget, $B$. Mathematically, the constrained optimization problem can be formulated as:

\begin{align*}
Maximize_{x_1, \cdots, x_n} \text{ } & U(x_1, \cdots, x_n)\notag\\
\text{subject to } & \Sigma_{i=1}^n x_i*c_i \leq B.\notag
\end{align*}

This example highlights the need for algorithms to solve such constrained optimization problems that arise in various fields, such as resource allocation, portfolio optimization, and image reconstruction.

Projected Gradient Descent

Then, how can we incorporate the constraints into the optimization process so that we can balance between optimizing the objective function and constraining parameters? Projected Gradient Descent (PGD) addresses this challenge by ensuring that the iteratively updated parameters belong to the feasible region defined by the constraints.

The key idea behind PGD is to project the current solution onto the feasible region at each iteration. This projection step involves mapping the updated parameter onto the closest point within the feasible region in case if lands outside of it, effectively “projecting” it onto the constraint boundaries. By doing so, PGD guarantees that the resulting parameters remain feasible throughout the optimization process.

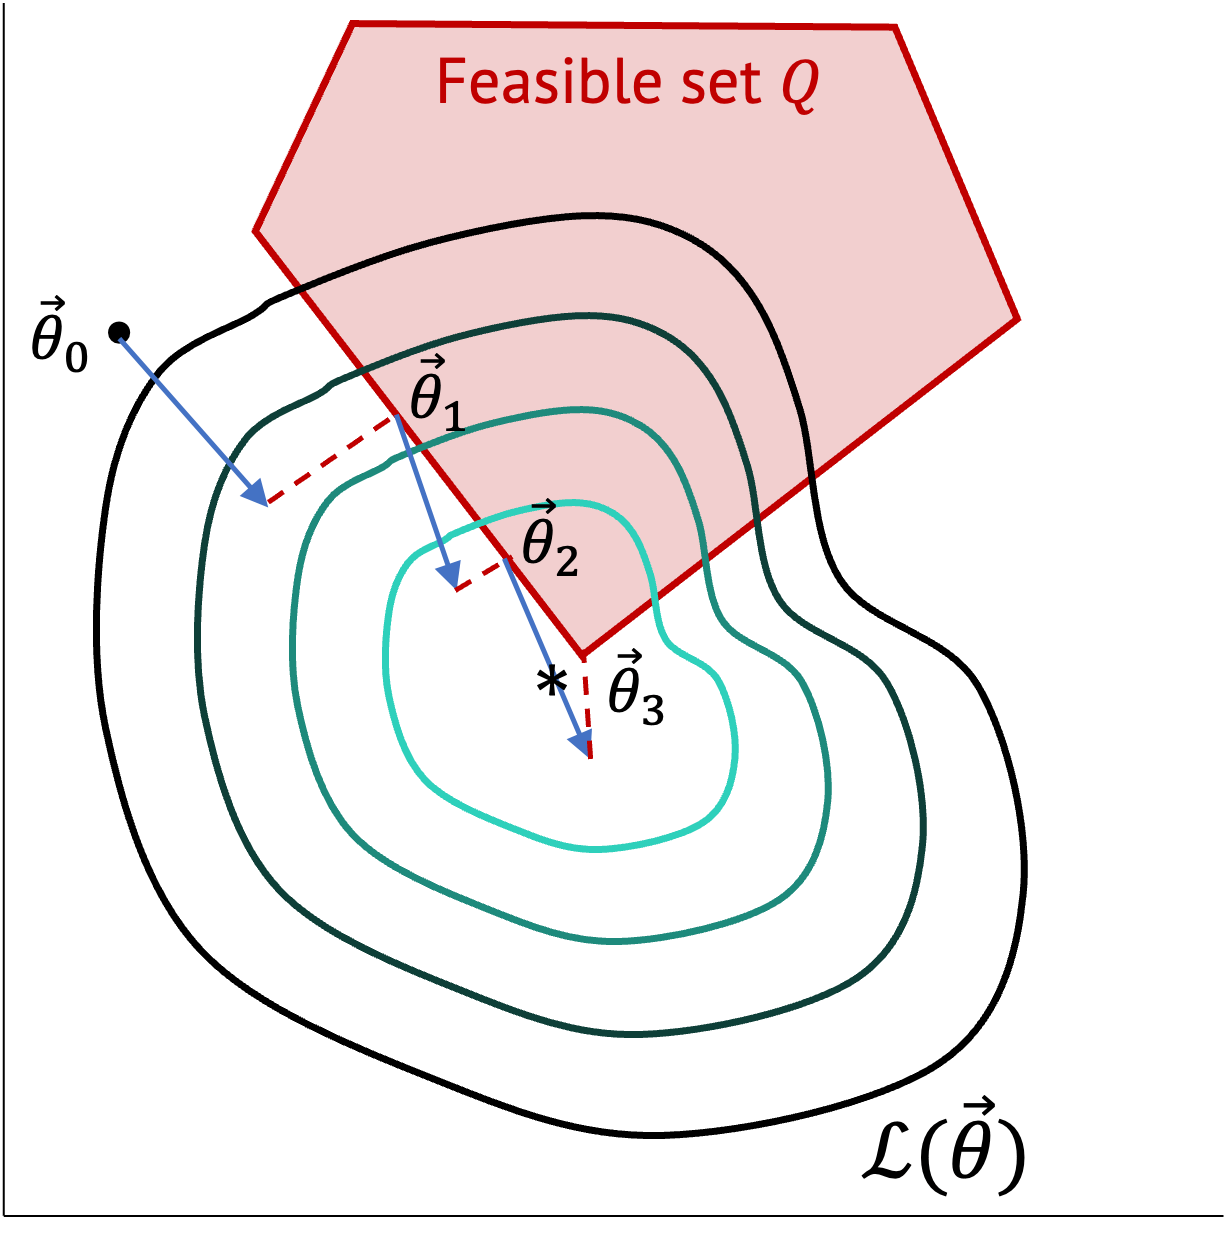
To illustrate, let’s consider a constraint \(A\theta = b\) for our optimization problem. Assume Q is the feasible set for the constraint (the red region from Fig. 1) and P is the projection function onto $Q$:

\[Q = \{\theta|A\theta = b\},\]
\[P: \theta’ \mapsto arg\,min_{\theta \in Q} \frac{1}{2} ||\theta – \theta’||^2 .\]

Projected gradient descent is defined as follows:

\[\theta_{t+1} \leftarrow P(\theta_t – \alpha_t \nabla_\theta \mathcal{L}(\theta_t)).\]

Projected gradient descent. The blue arrow denotes the usual gradient descent step on the loss function. The red dotted line denotes the projection onto the feasible set.

For the Lipshitz constant \(L\) and the step-size \(\alpha_t = \frac{R/G}{\sqrt{t}}\), it is known that if \(R \geq ||\theta_0 – \theta||_2\) and the gradient of \(\mathcal{L}\) is bounded by a constraint \(G\), i.e., \(G \geq ||g||_2\), \(\forall g \in \frac{\partial \mathcal{L}}{\partial \theta}\), the inequality \(\mathcal{L}(\theta_t) – \mathcal{L}(\theta^*) \leq C \frac{L}{\sqrt{t}}\) holds.

Mirror Gradient Descent

Mirror Gradient Descent (MGD) is a fascinating optimization technique that combines the power of optimization with the concept of duality. It draws inspiration from convex duality, a fundamental concept in convex optimization that establishes a relationship between primal and dual problems. MGD exploits this duality to transform the original optimization problem into a dual problem and solves it using a gradient descent-like approach.

In MGD, the optimization process involves iteratively updating the primal parameter in the primal space, while simultaneously updating the corresponding dual parameter in the dual space. The updates are performed by taking steps in the direction opposite to the gradients of the primal and dual objectives. This dual update is analogous to a mirror reflection of the primal update, which is the reason why this algorithm is called by the name “Mirror Gradient Descent.”

The motivation to work in the dual space is that it can often be simpler or have desirable geometric or algebraic properties, leading to more efficient optimization. MGD has been applied to various domains, including convex optimization, machine learning, and signal processing. It offers a powerful framework to tackle optimization problems with complex constraints or objectives, leveraging the interplay between primal and dual updates to achieve efficient convergence and desirable parameters.

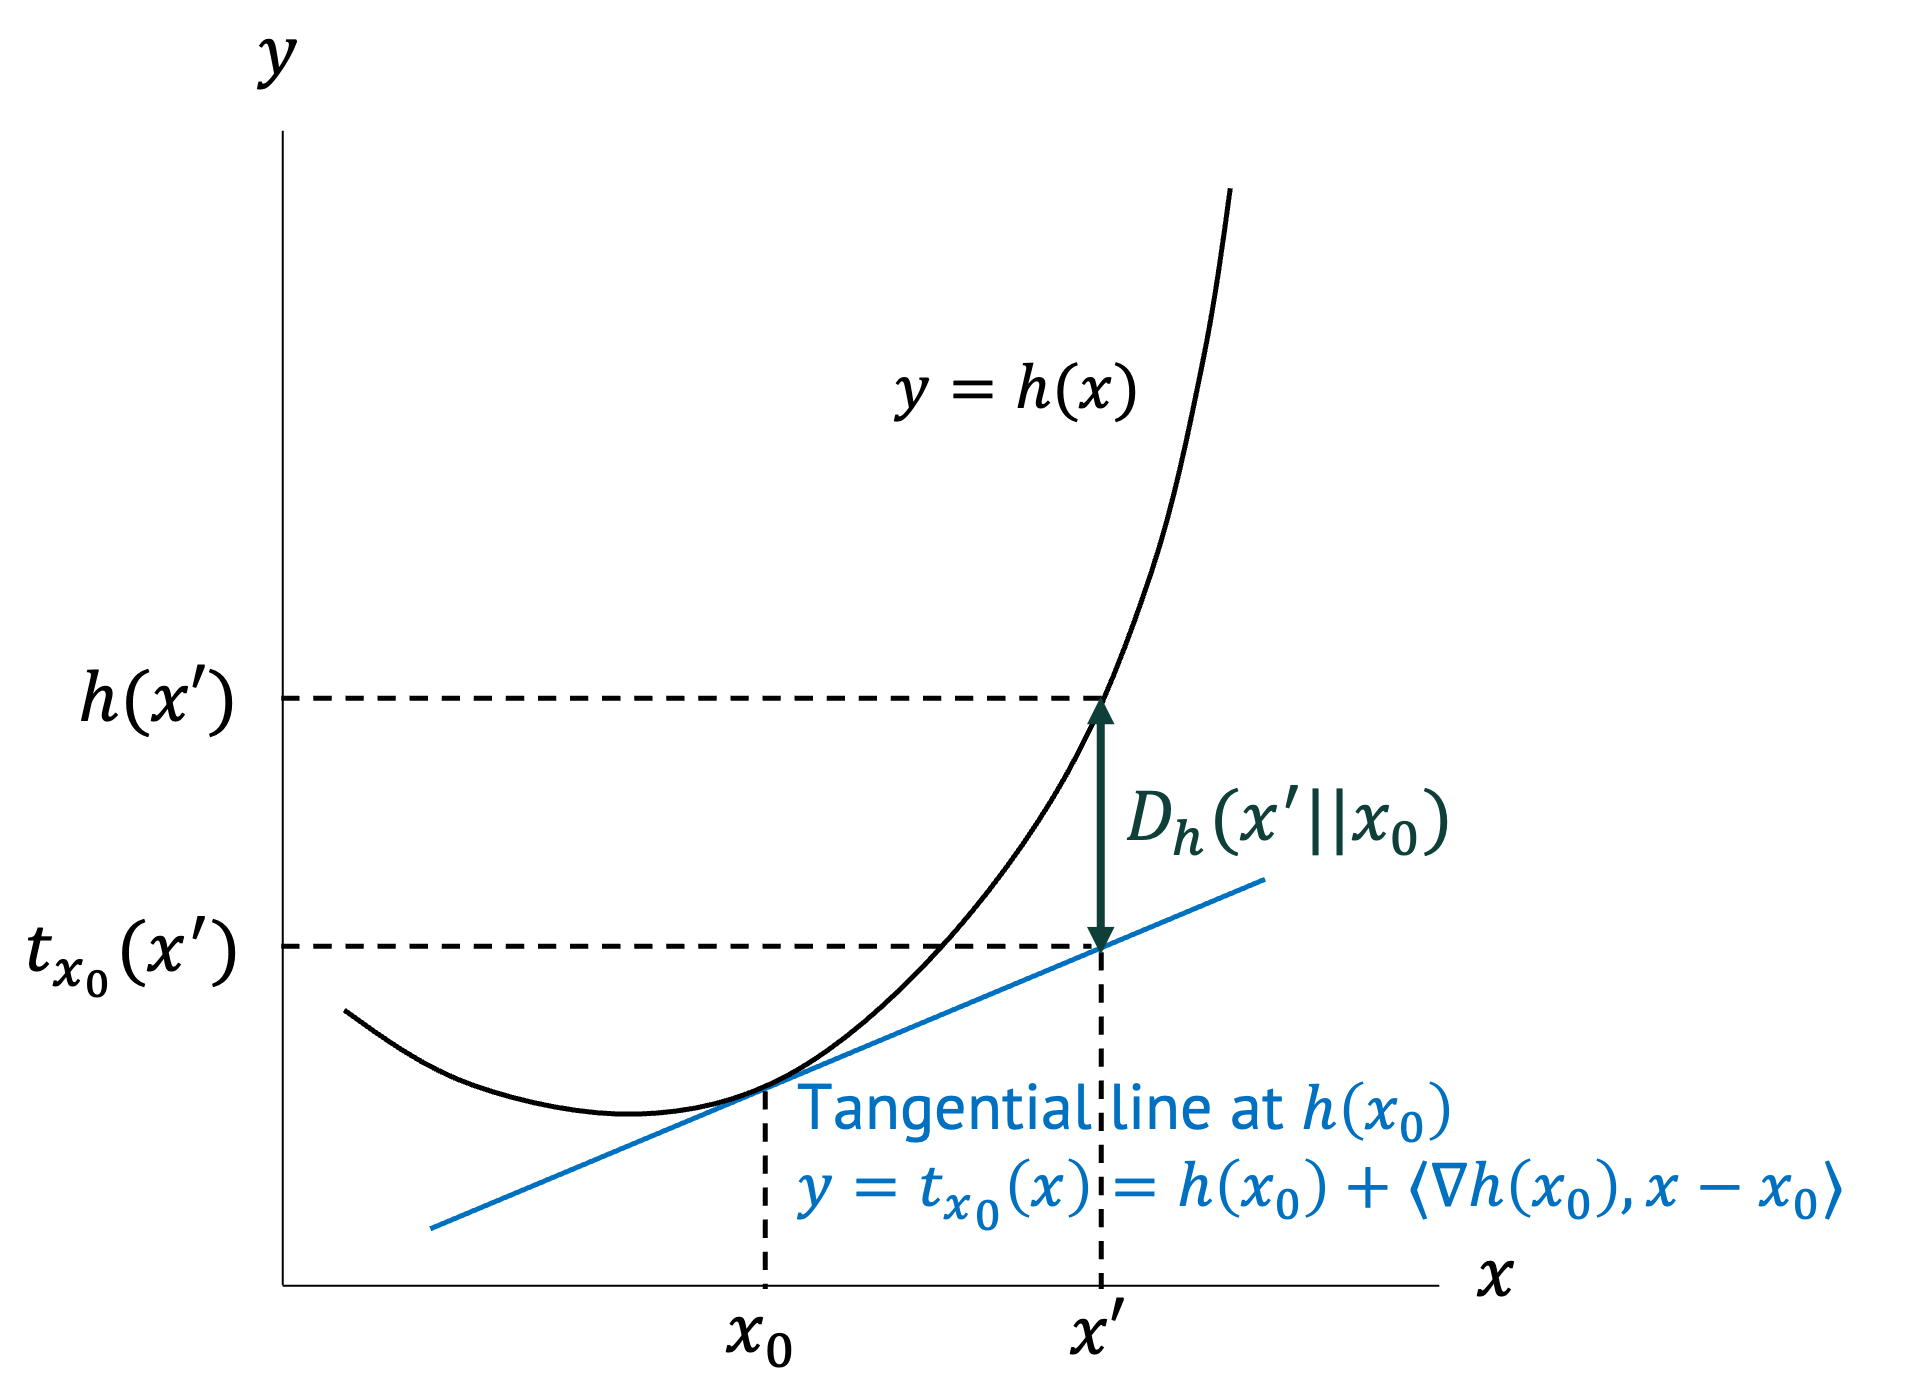
Before we dig into MGD more, let’s first define Bregman Divergence of a function \(h\) as \(D_h (x’||x)\).

\[D_h (x’||x):= h(x’)-h(x)-\langle \nabla h(x), x’-x \rangle \]
(\(\langle \cdot,\cdot \rangle\) is dot product.)

If we do the first order Taylor expansion of a function $h$, the tangential line at \(h(x)\) crosses a point \((x’, h(x) + \langle \nabla h(x), x’-x) \rangle) \). Bregman Divergence \(D_h (x’||x)\) is the gap between \(h(x’)\) and \(h(x) + \langle \nabla h(x), x’-x) \rangle \). It becomes large when the function \(h\) is steeper.

Bregman Divergence.

Mirror gradient descent is defined as follows:
\[\theta_{k+1} \leftarrow arg\,min_\theta {\langle \alpha_k \mathcal{L}(\theta_k), (\theta – \theta_k) \rangle + D_h (\theta||\theta_k)}. \]

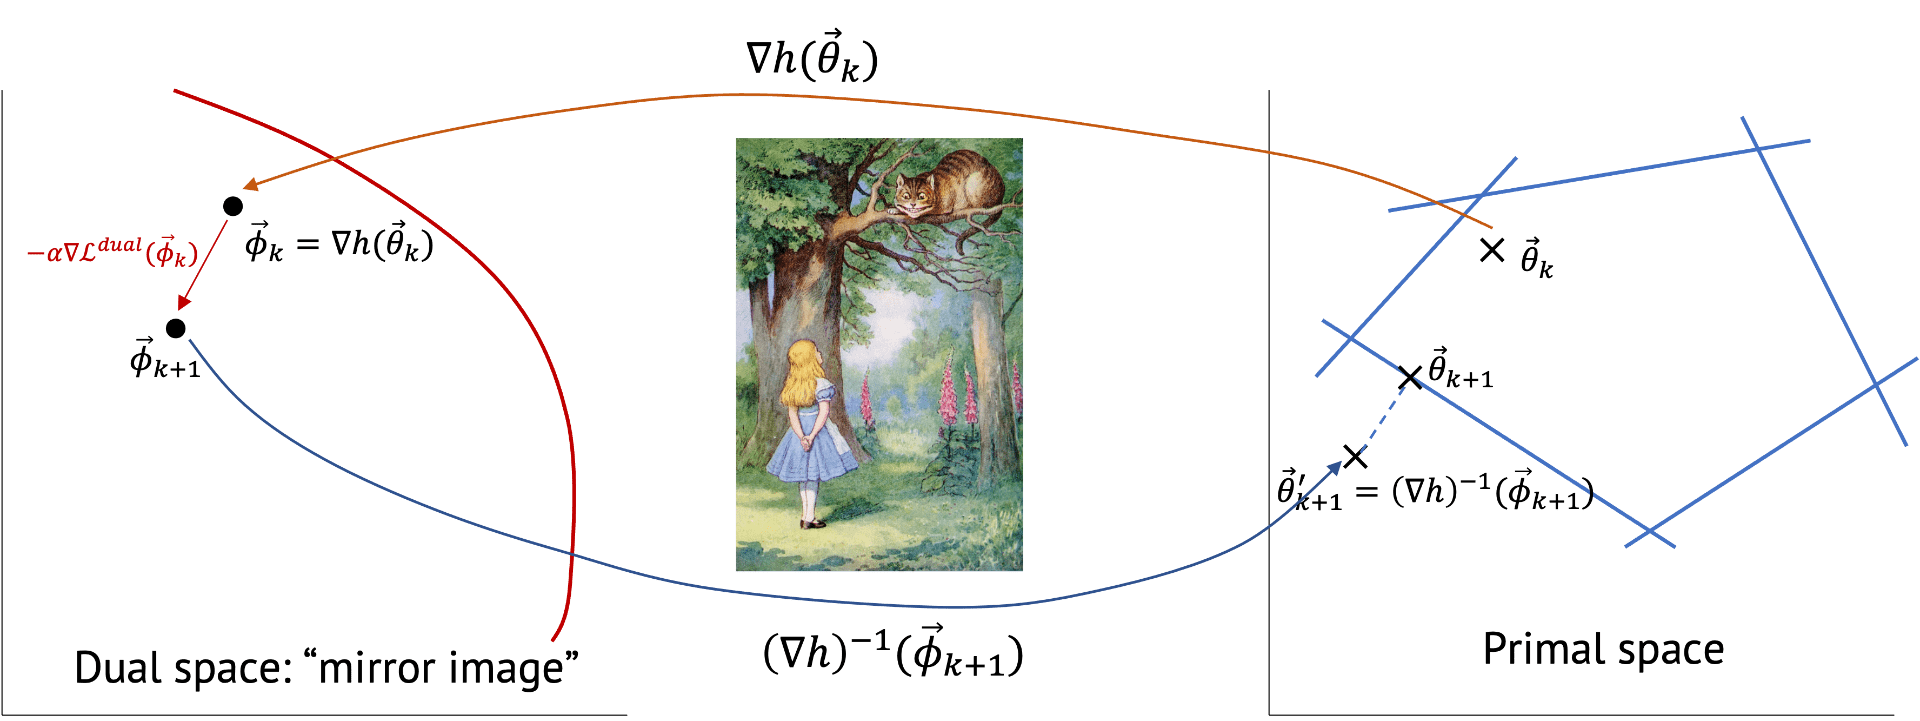
The concept of mirror gradient descent is that we first transform (with \(\nabla h(\theta_k)\)) the primal space of \(\theta\) into the dual space of \(\phi\) which possibly have an easier geometry, update the parameter, and do inverse-transform to come back to the primal space.

Mirror gradient descent. The blue dotted line denotes the projection onto the feasible set of the primal space.

Now, let’s first get a mirror image in the dual space and then project it back (with \((\nabla h)^{-1} (\phi_{k+1}))\) to the primal space.

\begin{align*}
0 & = \frac{\partial}{\partial \theta} \{\alpha \langle \nabla \mathcal{L}(\theta_k), \theta_{k+1}-\theta_k \rangle + h(\theta_{k+1}) – h(\theta_k) – \langle \nabla h(\theta_k), \theta_{k+1} – \theta_k \rangle \} \\
& = \alpha \nabla \mathcal{L}(\theta_k) + \nabla h(\theta_{k+1}) – \nabla h(\theta_k)
\end{align*}

Finally, we get the update equation for mirror gradient descent:
\[\nabla h(\theta_{k+1}) = \nabla h(\theta_k) – \alpha \nabla \mathcal{L}(\theta_k) \]
\[ \theta_{k+1} \leftarrow (\nabla h)^{-1} [\nabla h(\theta_k) – \alpha \nabla \mathcal{L}(\theta_k)]. \]

Note that for constrained optimization program, the projection onto the feasible set can be applied afterward.

Example 1. For \(h(\theta)=\frac{1}{2}||\theta||^2\), Bregman Divergence becomes \(D_h(\theta||\theta_k) = \frac{1}{2} ||\theta-\theta_k||^2 \). Substituting Bregman Divergence and rewriting the update equation, we get

\[\theta_{k+1} \leftarrow arg\,min_\theta \{ \langle \alpha_k \nabla_\theta \mathcal{L}(\theta_k), (\theta – \theta_k)\rangle + \frac{1}{2} ||\theta – \theta_k||^2 \}.\]
Then,

\begin{align*}
0 & = \nabla_\theta f = \frac{\partial f}{ \partial \theta} \\
& = \frac{\partial}{\partial \theta} \{\langle \alpha_k \nabla_\theta \mathcal{L}(\theta_k), (\theta – \theta_k) \rangle + \frac{1}{2} ||\theta – \theta_k||^2\} \\
& = \frac{\partial}{\partial \theta} \langle \alpha_k \nabla_\theta \mathcal{L}(\theta_k), \theta \rangle – \frac{\partial}{\partial \theta} \langle \alpha_k \nabla_\theta \mathcal{L}(\theta_k), \theta_k \rangle + (\theta-\theta_k) \\
& = \alpha_k \nabla_\theta \mathcal{L}(\theta_k) + (\theta-\theta_k)
\end{align*}

which corresponds to the basic gradient descent \(\theta_{k+1} = \theta_k – \alpha_k \nabla_\theta \mathcal{L}(\theta_k) \). Indeed, gradient descent is a special case of mirror gradient descent with this \(h\). Another intuition for recognizing it is that for \(h(\theta)=\frac{1}{2}||\theta||^2\), \(\nabla_\theta h = \theta, (\nabla_\theta h)^{-1} = \theta \), i.e., the transform is one-to-one mapping. Hence, we get \(\theta_{k+1} = \theta_k – \alpha \nabla \mathcal{L}(\theta_k) \).

Example 2. \(h(\theta) = \Sigma_i \{\theta_i \ln(\theta_i) – \theta_i\} \) where $\theta$ satisfies \(\Sigma_i \theta_i = 1\).

\[\nabla h = [\ln(\theta_1), …, \ln(\theta_n)]^T, (\nabla h)^{-1} = \exp (\theta) \]

\[\langle \nabla h(\theta), \theta’ – \theta \rangle = \Sigma_i \frac{\partial h}{\partial \theta_i} (\theta’_i – \theta_i) = \Sigma_i (\ln \theta_i) (\theta’_i – \theta_i)\]

\[\Rightarrow D_h (\theta’||\theta) = \Sigma_i \{\theta’_i \ln(\frac{\theta’_i}{\theta_i}) – \theta’_i +\theta_i\} = \Sigma_i \theta’_i \ln(\frac{\theta’_i}{\theta_i})\]
using $\Sigma_i \theta_i = \Sigma_i \theta’_i = 1$. Note that with this $h$, Bregman Divergence converges to KL Divergence.
The update equation for mirror gradient descent becomes
\[\theta^{i}_{k+1} \leftarrow \exp(\ln(\theta_k) – \alpha \nabla \mathcal{L}(\theta_k)) = \theta_k \exp(-\alpha \nabla \mathcal{L}(\theta_k))\]

Typically, it’s good to use mirror descent if you are able to pick a good \(h\) for that class of problems.

There are also many other variants of gradient descent. Each algorithm possesses unique strengths, you may try to find what suits the best for your own optimization problem. Understanding and utilizing these techniques expands our problem-solving capabilities across diverse fields. So, please feel free to embrace these algorithms and explore their potential in your own endeavors.

Conclusion

Projected and Mirror Gradient Descent are powerful tools for constrained optimization problems in ML. These algorithms are more computationally expensive that regular gradient descent due to their need to address the constraints. The Bregman Divergence is an expressive way to represent many forms of optimization (e.g., Examples 1 and 2). Constrained optimization is key in safety-critical domains, such as ML for robotics and healthcare where constraint satisfaction must be enforced. Note: check out our blog post on KKT conditions for an alternative approach for constrained optimization: The method of Lagrange Multipliers.

Acknowledgements

This blog post was developed in part with support from course materials available at http://www.cs.cmu.edu/afs/cs.cmu.edu/academic/class/15850-f20/www/notes/lec19.pdf

Filed Under: Bootcamp

Presentation Guidelines for PhD Proposal

June 13, 2023 by Batuhan Altundas, Arthur Scaquetti do Nascimento, Manisha Natarajan and Matthew Gombolay

Presenting your PhD Thesis Proposal is an exciting step in your PhD journey. At this point, you will have formed your PhD committee, developed initial results (potentially published one or more papers as the foundation to your proposal), and formulated a plan for conducting your proposed research. Many students can find the proposal experience stressful. In a sense, the proposal defines the “story” you will tell for years to come, including at your Thesis Defense, faculty job talks, and beyond. However, it is important to focus on the here and now rather than getting wrapped up in the expectations for the future and so many things that are outside of your control. Try to focus on what you can control and do the best you can to deliver a high-quality proposal.

This blog is a guide to help you do that — give a high-quality proposal presentation. This guide omits much about how to give a talk in general and instead focuses on common issues that come up specifically at the PhD Proposal Presentation stage of one’s academic development. For many, this may be the first time you will be presenting to an audience of professors your prior work and a proposal for what you will accomplish in a longform (e.g., 45-50 minutes) talk and be expected to defend your plan for an additional 45-50 minutes. Remember, the Committee’s job is to critique your work and challenge you into a better Thesis direction, to make your research better. Expect to be challenged and for your proposed work to change coming out of the proposal — this is a good thing 🙂

Having said all that, here is a non-exhaustive list of tips in three sections: Before, During, and After (i.e., the Q&A session) the proposal presentation.

Before The Proposal

1) Meet Committee Members a priori

Interviewing your Committee members before your Proposal is a great way to get to know them personally and allow you to assess the compatibility of the Committee Candidate and yourself. Share with them a compressed thesis pitch and get their feedback (include the proposed Thesis Statement from Point 2 below). If there appears to be an irreconcilable issue with your proposed work, you should both (1) consider the feedback you received with your PhD advisor to see if you can make the proposal better and (2) consider whether that committee member might present an insurmountable critic for you in successfully defending. Not everyone will like your work — that is ok. Just try to learn from every critic to see if you can make your proposal sharper.

After selecting your committee, meet with each member before the Proposal Presentation to ask if you are ready to Propose. That will give you a good indication (and hopefully lead to more profound feedback) of the level of critique of your work, as well as their expectations for improvements.

  • It allows you to get comfortable with them, making the Proposal presentation less stressful.
  • It gives you an opportunity to present the work to your Committee Members and give them an overview of what they can expect from the Proposal.
  • If they support you going through with presenting your Proposal, they are more likely to support you during the Proposal and vote in your favor. If they state that your work is not ready to be proposed, they can also offer suggestions to improve it and ensure that you are ready to  propose.
  • It allows the student to get a sneak peek at questions the Committee Members may ask during the Proposal and gives you time to prepare answers.

During The Proposal

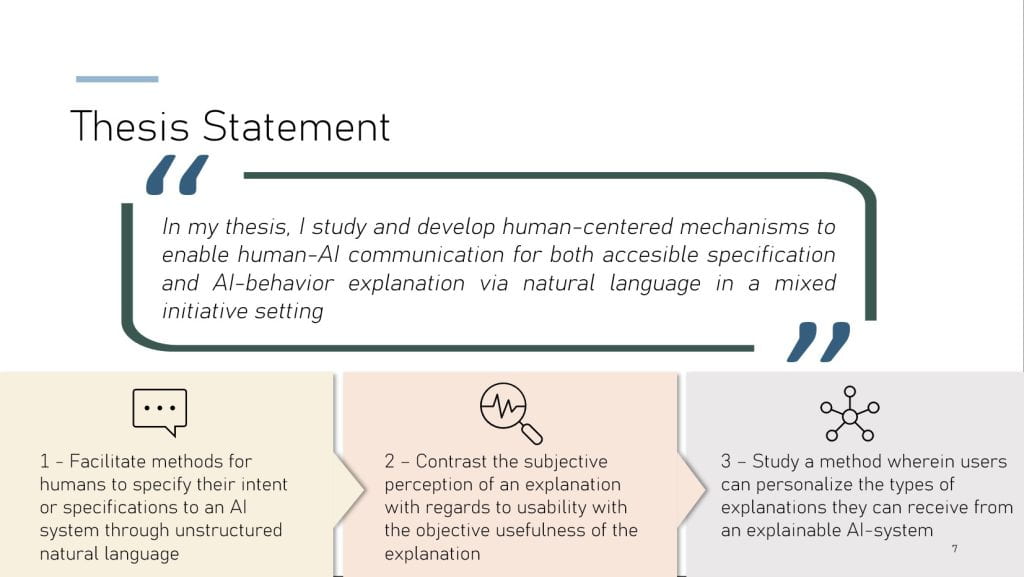
2) Have a clear Thesis Statement

  • Present the thesis statement before going over your research and at the end, tying everything together with that “golden” paragraph.
  • A Thesis Statement should be nonobvious. Always remember that the proposal should set up the proposed research, experiments, and analysis. These components will serve as the supporting arguments and evidence in favor of your Thesis Statement.
  • Be mindful that your Thesis’ scope presented in your Proposal is subject to change based on feedback from the Committee. The purpose of clearly laying a Thesis Statement is to show that you are working towards a cohesive topic.

    Figure 1: Sample Slide from Pradyumna Tambwekar’s Proposal. The student shows a clear statement early in the presentation, and breaks it down into the main steps, which will serve as his roadmap.

3) Have a Venn Diagram of the Literature Review

Every proposal needs to present to the committee a review of the relevant literature. The proposer needs to convey that the proposer has assimilated a representative set of knowledge from prior work and that the proposed work is novel and significant. A Venn Diagram of the research based on topics is a good method of presenting prior work and situating your proposed work within this sea of prior work.  Typically, your Thesis will be at the intersection of multiple (sub-)fields, and your work would lie at the intersection. Here are some advantages of this diagram:

  • Having a Venn Diagram of previous literature, and where your own previous and future works fall into shows that you have done your literature review, have worked on topics related to these research and how your work fits in the broad scope of the fields.
  • It showcases the novelties that you are bringing to the research committee. Most theses combine multiple topics into a cohesive whole and address a problem that had not been addressed, or use an approach that has not been used in the past.
  • It makes your committee have more confidence in your work given your understanding of relevant literature and how your scientific production fit in to the field.
Figure 2: Sample Slide from Esmaeil Seraj’s Proposal. The Venn Diagram shows the previous work that has been conducted in a field, how the student’s work up to the proposal fits into these fields of research, which areas of interaction exists, and where the proposed work will fit in.

Pro Tip: While a Venn Diagram is a good starting point, you can consider variations.

4) Reminders, scaffolds, and roadmaps

The flow of your presentation must be smooth, and this is a great technique to let the audience know how things are connected and whether you are done with a point, or still talking about it. Jumping from topic to topic would get your audience confused. Each work should be linked to the Thesis Statement and ideally to each other. Make sure you verbally and graphically tell the audience when you are switching from one topic to another, and how they relate (in case they do).

  • Roadmap: Your Thesis should hold cohesion, a story that you can refer to as you progress through your presentation. A roadmap is an overview of the steps, aims, and previous research you have conducted that make up your work. These are the parts that make up your Thesis. The purpose of the roadmap is to allow for a smooth flow of your presentation and a method for your Committee to evaluate each work with respect to the whole.
  • Scaffolding: Before presenting each research aim, refer back to the Thesis Statement and previous research you have done, point out what needs to be addressed next and how it relates to the next research aim you are going to present.
  • Reminders: Once each section of your research is complete, refer back to your Thesis statement, explain how what you have presented fits into the broader scope of your Thesis, and re-emphasize your Thesis Statement.

Consider the example outline slide shown below (Figures 1-2) that combines a presentation overview and elements of a thesis statement that would appear throughout the presentation to transition between sections.

Figure 3: Sample Slide from Esmaeil Seraj’s PhD Defense, where the Thesis Statement is structured around research conducted prior to the proposal (in blue and green) and research conducted after the proposal (in red).


Figure 4: Sample Slide from Pradyumna Tambwekar’s Proposal. Notice how the student keeps track of the topics that were already covered on the top of the page.

5) Acknowledge collaboration

It is likely that you have worked with others when doing research. Be clear on who has done what and assign credit where it is due as you go through each of your research aims, preventing possible accusations of plagiarism. Acknowledge second authorship (i.e. “in this study led by Jane Doe, we looked into…”). Collaboration is not a bad thing! You just need to acknowledge it up front.

6) The Art of Story Telling (Your Technical Deep-dive)

The best stories have one nadir or low-point. In a story like Cinderella, the low-point is typically sad, coinciding with the protagonist’s efforts having fallen apart. However, in the PhD thesis proposal, you can think of this point as the opportunity for the deepest technical dive in your talk.  Typically, an audience has a hard time handling multiple deep-dives — humans can only pay attention hard enough to understand challenging, technical content about once in a talk. Proposals that start with the low-level technical details and stay low-level for the next hour are going to cause your audience to have their eyes glaze over.

Note: You can also think of the beginning of the story as either an exciting motivation (like Man In Hole or Boy Meets Girl) or a motivation based upon a tragic or scary problem that your research is trying to address (e.g., like Cinderella). This point deserves its own whole blog post! Stay tuned 🙂

Basic Plots: Vonnegut's Cinderella | Story Empire
Figure 5: Image courtesy: https://storyempire.com/2021/02/12/basic-plots-vonneguts-cinderella/.

7) Modulate your voice and body language

Just like the entire presentation tells a story, think of each slide as telling a story. Your voice and body language can do a lot to help the audience follow the argument you are trying to make.

  • Use your steps around the room to help with your pacing (it is often helpful to sync your voice with your steps).
  • Use dramatic pauses (and stop walking) after each argument or punchline – that helps the audience to absorb your point or catch up with the train of thought.
  • Upspeak can be helpful to show enthusiasm in between points, but be mindful that its overuse could be perceived as a lack of confidence.
  • Breathe from your diaphragm.
  • Other voice dynamics techniques can be useful.

8) Talk about everything on your slide

If you have content on your slide, your audience will want to understand it. If you do not explain it, that will frustrate your audience. Please take the time to talk through everything on your slide. If you don’t want to talk about it, then perhaps you shouldn’t have it on the slide to begin with!

If you have a lot of content on a slide, use animations to control when piece of text or figures pop up on your slides. Otherwise, your committee may start paying attention to the slide to understand the myriad of content and ultimately ignore everything you are saying. Animations are your friend for complex slides. Use animations (or sequences of “build-up” slides) to get the timing right so that your voice and the slide visuals are synergistic. Though, please note that animations can become cheeky, so don’t go overboard.

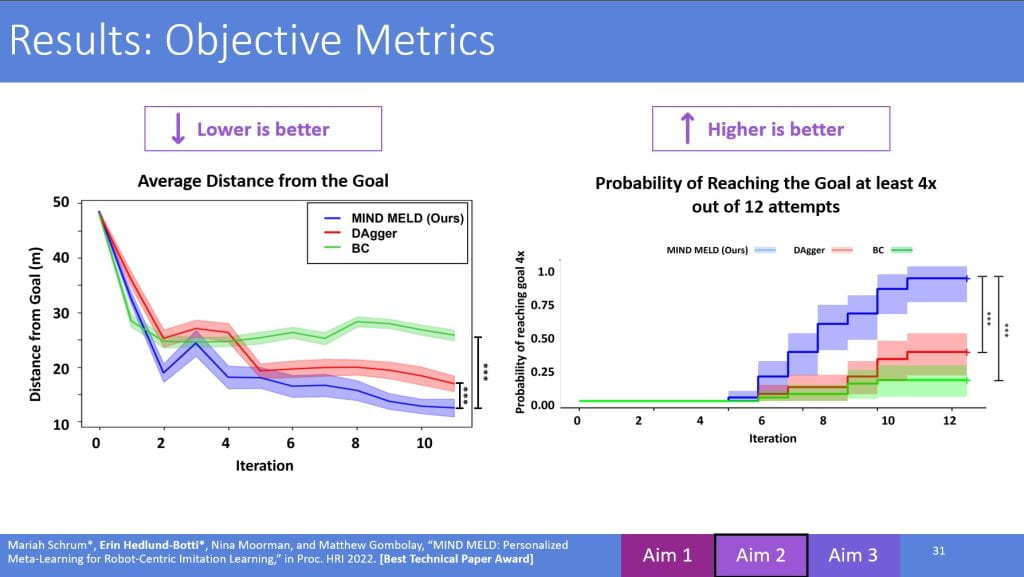
A key issue here is that proposer often forgets to explain all figures and plot axes. Your committee will not instantly understand a figure even though it is a visual. Describe the metrics used, go through the legend, and detail every aspect of the plot so that each member of the audience can see the patterns you want them to recognize.

In summary, you need to:

  • Convey clarity and transparency.
  • Define and explain the axes and metrics.
  • Make it clear whether higher or lower is better for each figure.
  • Note: explaining a figure helps with controlling your own pacing and locking the attention of the audience. Use that moment to re-calibrate it.
Figure 6: Sample Slide from Erin Hedlund-Botti’s Proposal. Notice that all axes are labeled, and all the important information is highlighted. Moreover, the bottom of the slide touches on tip #4. Note that the use of titles in figures is a arguable point, but it is important to include a title or other distinguishing feature when you have multiple figures on a single slide.

9) Have takeaways or “bumpers” on your slides

Clearly show what the scientific novelties/engineering advances of your work are and why it is worth doing what you are doing. This is the part where salesmanship comes in. Answer the following questions:

  • What is the Scientific Impact/Advancement?
  • Where does it stand with respect to prior literature and how is it novel?
Figure 7: Sample Slide from Erin Hedlund-Botti’s Proposal. The student has Key Takeaways for each of the aims presented in the Proposal. This also acts as a recap and preparation for the next topic that will be introduced.

10) Have a Timeline and a List of Planned Publications

A Proposal is a plan for the future that your Committee can look into and suggest changes going forward to the final stretch of the Thesis. As such, a timeline in the form of a Gantt Chart, along with a list of Planned Publications would provide a greater insight on what the Proposed work will be and how it will be done.

The planned work acts as a preview of what the Committee can expect from the Thesis Defense and when it will take place. It also allows them to assess both the quality and feasibility of the proposed work.

Figure 8: Sample Slide from Erin Hedlund-Botti’s Proposal showing the timeline through the published works.

After The Proposal Presentation (The Q&A Session)

11) First things first…

  • Repeat the question back for the sake of the audience.
    • It allows the audience to pay attention to the question being answered if they have not heard it at first.
    • It gives you time to think over an answer.
    • It allows you to get a confirmation that you understood the question. It also allows them a chance to interrupt and clarify the question.
  • If there is jargon in the question asked…
    • If you are unfamiliar with a jargon, ask them to explain it, especially if it is within their specific area of expertise.
    • If you do know what the jargon means (or if it has multiple definitions and one is best for your purposes), define it from your perspective (ideally backed up by literature that you can reference).
    • Discuss the scope of your research with respect to the field in question. How does it fit in with other research? What specifically is being tested and what is not being tested, and for what reason.
  • Thank a question-asker for “good” questions (not “bad” questions).
    • First, note that “good” and “bad” are commonly used adjectives but are judgmental, unhelpful, and best to avoid. A better way of describing these types of questions would be to differentiate between 1) questions for which there is not an established answer and would require an expert to deeply think about the answer and possibly conduct experiments or analysis versus 2) questions with a well-established answer. It is best never to say a question is actually good or bad.
    • With that established, a common practice is for an answerer (e.g., the PhD Thesis Proposer) to say, “That’s a good question,” before answering each question. The challenge here is that experts in the field hearing the proposer label a question as “good” when the question has a well-established answer can make the proposer appear either ignorant or patronizing.

12) When someone asks you a question and you don’t know the answer…

In the case you get asked a question to which you do not know the answer, say that you do not know the answer. A part of being a scientist is to admit one’s ignorance and work to address it. Not everyone is aware of everything. Acknowledging a lack of familiarity with a topic or a research is acceptable and shows a scientific mindset.

  • When relevant, use phrases such as:
    • “I am unfamiliar with that work, but I will be glad to look into it after the proposal.”
    • “I am not sure, but I would hypothesize/speculate that the outcome would be…”
    • “I have not heard that term before. Could you please define it for me?”
    • “I do not have an answer to that, but here is how I would go about conducting an experiment to find out the answer: …”
  • DO NOT pretend to know something you do not know. It is easy for an expert to tell your familiarity with a topic with the right questions.
  • After proposing, look up the information the Committee presented. By following up any mistake or discussion point, you show your diligence and reassures the Committee that you are willing to compensate for your lack of knowledge.
  • Follow up, either in a later meeting or through email, after doing the research related to the information you are unfamiliar with. Show that you are willing to learn and improve.

13) When the audience points out a reasonable weakness or limitation in your approach, acknowledge it.

If the person asking a question makes you realize you have a weakness in your proposal or position, admit the validity of their question or point. This may be a “proposal defense,” but don’t dig in your heels and defend a flawed position with weak arguments. Be respectful and humble.

Research is never perfect. Being aware of where and when your research fails is an important part of being ready to be a PhD Candidate. The Committee wants to see the limitations/weaknesses of your work. They also want to see that you are aware of these limitations and either work to address them, or have an idea of how it can be addressed in future works.

14) Have Backup Slides

Show off your preparation and have backup slides. Prepare for questions that you would expect (e.g., regarding more technical details, ablation studies, metrics’ definitions, why you have chosen this approach compared to any other alternatives).

When a question comes up, do not try to answer the question just with your own voice. Take advantage of the preparation you have done and go to backup slide you prepared. The more you can show you were prepared, the more likely the committee will be to give you the benefit of the doubt and cease their interrogation.

Be careful, though. Often students will copy+paste equations or simply “dump” material from external sources into backup slides. When the proposer then pulls up this content and seeks to present it, the proposer will fall short of coherently explaining the content on the slide. You are responsible for everything you put on every one of your slides, so please do your due diligence to understand the material you are presenting.

Pro tip: Don’t copy+paste any equations. Professors often look for this and see it as a sign you might not understand the content.  Take the time to recreate the equations with your own symbology using an equation editor in the software you are using to create your slide deck.

15) When the Committee Asks About Applications, You Do Not Have to Invent Something New

Your research should address an important, existing problem — or at least one the committee thinks is likely to exist and be important in the near future. Your motivation slides should present that problem and show the committee that you have considered why the work you have done is important.

  • When asked about applications, reference the applications you have already modeled or analyzed. You do not have to come up with new applications as you are presenting — moving further away from the application that you have worked on exposes you to questions that may be unfamiliar.
    • If asked about a potential application that you have not thought through before, be open to think-aloud to consider how you might go about applying your work to that scenario. However, let the committee know first that you have not studied that potential application and are thinking aloud about how to assess both the feasibility and success of such an application in the future.
  • Professors are looking to ground work done on toy or simulated domains (e.g., a grid-world domain, a videogame, etc.) into something able to solve real-world problems. Researchers should be aware of what they are trying to contribute towards.
    • Ideally, work done in a simulated or toy domain has a real-world analogue. Without over-selling your work, ground your analysis in the real-world domain that motivates your work.
    • Have a very pithy description of the domains you tested or are planning on testing. What are the scientific novelties/engineering advances of your work and why it is worth doing what you are doing. Keep it short and relatable, similar to an elevator pitch. Provide generic examples and do not over-complicate. If someone requires a more in-depth explanation, they can always ask.


Filed Under: Navigating the PhD

Bootcamp Summer 2020 Week 7 – DQN And The Deadly Triad, Or, Why DQN Shouldn’t Work But Still Does

July 9, 2022 by Laura Strickland and Matthew Gombolay

Deep Q Networks (DQN) are an effective deep learning method for solving many problems. DQN is not, however, foolproof and can be quite difficult to train effectively or can simply fail to learn. The authors of this paper discuss the three main reasons that DQN can fail—the so-called Deadly Triad—and why DQN can sometimes work anyway.

The components of the “Deadly Triad” are:

  1. Function Approximation
  2. Bootstrapping
  3. Off-policy Learning

In this blog post, we define and discuss each of these and some ways in which they can be mitigated.

Why is this important? Everything we know suggests that DQN should not work, and if it does, we got lucky with our setup. But DQN does work, at least some of the time, and more reliably than one might expect. This suggests that we don’t yet fully understand what is going on in DQN. In the remainder of this blog post, we cover what the components of the deadly triad are, the problems they can cause, and some of the ways we can sidestep their undesirable effects.

1. Function Approxmiation

Function approximation in Reinforcement Learning gives us the ability to better handle large state and action spaces by approximating the function we are trying to learn (e.g. a Q-function) rather than learning the function exactly. First, we cover the basics of how RL can work without function approximation, then look at how function approximation is applied when the state and/or action spaces become too large to sample effectively using exact techniques, such as value iteration or policy iteration.

The Q-function $Q(s, a)$—that is, the state-action value function—is a mapping of states and actions to a value in the set of all real numbers:

\begin{align}
Q: S \times A \rightarrow \mathcal{R}
\label{q_mapping}
\end{align}

Recall that value iteration evaluates the utility of a state as the value of the maximum Q-value at that state, over all the actions the agent can take in that state, as we see in Equation \ref{value_iter}.

\begin{align}
V(s) = \max_a Q(s, a)
\label{value_iter}
\end{align}

When we look at methods that use the Q-function, such as value iteration, we form a table for $V$ (see left of Fig. 1) and for the Q-values (see right of Fig. 1) and iteratively update those tables as our estimates of the utility of each state and the expected value of each state-action pair improve during training.

Left side: A table showing the utility of specific states in a simple discrete (or discretized) state space. Right side: A table showing the Q-value of specific state-action pairs in a scenario with simple discrete (or discretized) state and action spaces. (Note that these values are for illustrative purposes only.)
The utility of each state and the Q-value of each state-action pair can be represented in tabular forms. Note that the V(S) values in the left table correspond to the Q-values of the maximizing actions, according to Equation \ref{value_iter}.

Under the tabular (i.e. exact) setting, we can, given a sufficient number of iterations, learn the optimal Q-function, value function, or policy.

Usually, however, our state spaces are far too large for tabular Q-learning to be remotely practical. It simply takes far too long to cover the entire table thoroughly enough to reach convergence to the optimal policy, or anything even close. Even high-performance computers will lack the RAM required to store a large Q-table in memory. Rather than wait years for our learner to visit every state-action pair in the Q-table enough to allow the values to converge, we instead try to form an estimate of what this table would tell us using function approximation.

This function approximation was originally performed by effectively placing multi-dimensional Gaussians in our $Q(s, a)$ table to represent the action choices in the state space with probability distributions. These Gaussians interpolate a desired output value (e.g. a q-value) between inputs (e.g. state-action pairs). The number of Gaussian kernels $\mathcal{k}$ that we need to adequately cover all of the states and actions could be far smaller than the size of the $Q$-table, $|S| \times |A|$.

Modern approaches to function approximation employ neural networks. The neural network learns a surface, such as that shown in Figure 2, that covers what the Q-table did and estimates the utility of taking a specific action in a specific state, just as the Q-table does. Fitting a surface over the state $\times$ action space instead of a table has an additional benefit: when the agent finds itself in a state it has not encountered before, it can still interpolate an estimate of the utility of its current state using the function approximator (i.e. the neural network). An important point to remember, though, is that function approximation, despite this benefit, is almost never going to perfectly learn the Q-function. We can apply gradient descent to get closer to the true value function, but our function approximator will
almost never be perfectly accurate.

In this image, we illustrate that the π value of a specific state-action pair is output by the actor network used in a policy-gradient setup.
An example of a surface learned by a neural network trained with DQN.

Thus, using a function approximation is not true interpolation between the known-value points, but it is something close to it.

Function approximation is also used in policy gradient methods; neural networks can be used to represent the policy, as illustrated in Figure 2, and the transition function, as illustrated in Figure 3.

In this image, we illustrate that the π value of a specific state-action pair is output by the actor network used in a policy-gradient setup.
Representation of the policy network in policy gradient setups.
In this image, we illustrate that the transition probability of starting in state s, taking action a, and arriving in state s' is defined by a neural network.
Function approximation can represent the state transition function in policy gradient learning scenarios.

In a previous entry, we introduced the Bellman Residual (Equation \ref{bellman-res}). If we are parameterizing $Q$ by some $\theta$ such that $Q_{\theta}: S \times A \longrightarrow \mathcal{R}$, then we can use the Bellman residual as the loss function we use to train $Q_{\theta}$.

\begin{align}
L(\theta) = \mathbb{E} \left[ \left((r_t + \gamma \max_a Q_{\theta}(s_{t+1}, a)) – Q_{\theta}(s_t, a_t)\right)^2 \right]
\label{bellman-res}
\end{align}

Equation \ref{bellman-res} aims to minimize the error between the points that the agent has visited and estimated Q for and our predictions of what those points should be.

What is the problem with this? When we apply gradient descent, we assume that $(r_t + \gamma \max_a Q_{\theta}(s_{t+1}, a))$ from Equation \ref{bellman-res} is a constant with respect to $\theta$. Thus, when we take the gradient of $L(\theta)$, the only thing we apply the derivative to is $Q_{\theta}(s_{t+1}, a)$. We will see why this creates challenges for us in the next section.

2. Bootstrapping

With respect to the Deadly Triad, we define bootstrapping as taking information we already have and trying to do more with it than we should be able to do. Let’s look at the instability this can cause and the ways practitioners have come up with to mitigate these instabilities.

When we looked at policy gradients and REINFORCE, we learned that the update for the policy parameters $\phi$ is defined by Equation \ref{policy-grad-eqn}, where $i$ is the designator of the trajectory from which the states and actions are drawn (for the case of doing multiple policy rollouts), and $t$ is the timestep.

\begin{align}
\Delta \phi = A_{it} \nabla_{\phi} \log \pi_{\phi}(s_{it}, a_{it})
\label{policy-grad-eqn}
\end{align}

We compute $A_{it}$, the cumulative reward term, as shown in Equation \ref{a-i-t}.

\begin{align}
A_{it} = \sum_{t’=t}^{T_i} \left(\gamma^{t’-t} r_{t’} \right)
\label{a-i-t}
\end{align}

How is this applied? When computing $\Delta \phi$ and $A_{it}$, we look at each timestep in the trajectory from timestep $t$ until the end, identify what the reward is, and back up the (discounted) reward across prior timesteps. This means that a reward applied many timesteps into the future still affects this cumulative reward term, $A_{it}$. In a scenario that gives sparse rewards, backing up rewards to influence the
evaluations of earlier timesteps in this manner is particularly helpful, as it helps the agent learn the steps it took along the way to getting a reward at some specific timestep. This gives the learner information from later in the trajectory instead of it needing to rely on a Q-function to tell it whether it is going in a (positively) rewarding direction.

Notably, an alternative way to compute the gradient of $\phi$ is Equation \ref{alt-phi-grad}.

\begin{align}
\Delta \phi = Q_{\phi}(s, a) \nabla_{\phi} \log \pi_{\phi}(s_{it}, a_{it})
\label{alt-phi-grad}
\end{align}

When we are training $Q_{\phi}(s, a)$ with the Bellman residual and holding $(r_t + \gamma \max_a Q_{\phi}(s_{t+1}, a))$ constant, we encounter what we call the “chasing one’s tail” or “runaway” effect, which we discuss in the blog post about DQN. Specifically, in Equation \ref{alt-phi-grad}, we are using the Q-function as its own target by regressing $Q(s, a)$ towards the target, $R(s, a) + \gamma \max_{a’} Q(s’, a’)$, which itself contains $Q$!.
That is what bootstrapping means in the context of the Deadly Triad— using the thing that you are trying to achieve as the very thing you are using to achieve it.

What does not bootstrapping look like in Q-learning? Instead of computing $L(\theta)$ as we did in Equation \ref{bellman-res}, we compute the loss by looking $n$ steps into the future, as we demonstrate in Equation \ref{n-step-lookahead}.

\begin{align}
\hspace{-3.75em}L(\theta) = \mathbb{E} \left[ \left(\sum_{t’ = t}^{t + n – 1} \left(r_t + \gamma^{t’ – t} r_{t’}\right) +
\gamma^{t + n} \max_a Q(s_{t+n}, a) – Q_{\theta}(s_t, a_t) \right)^2 \right]
\label{n-step-lookahead}
\end{align}

We select $n$ such that the $n$th step will be beyond the final timestep of the episode, which simplifies Equation \ref{n-step-lookahead} to Equation \ref{n-step-lookahead-simp}.

\begin{align}
L(\theta) = \mathbb{E} \left[ \left(\sum_{t’ = t}^{t + n – 1} \left(r_t + \gamma^{t’ – t} r_{t’}\right) – Q_{\theta}(s_t, a_t) \right)^2 \right]
\label{n-step-lookahead-simp}
\end{align}

Q-learning is known for having an overestimation problem; the $\max$ operation that determines which action to select in a given state biases the estimation of Q-values of states to the high side, sometimes to the point of drowning out the reward signal. Sometimes this problem can be fixed by hyperparameter tuning, but not always. So how do we keep the bias caused by bootstrapping at bay?

How to fix bootstrapping?

A common tactic to alleviate the bias caused by bootstrapping is by applying Target Q-learning; that is, we have two Q-networks, and calculate the Bellman residual as shown in Equation \ref{loss-fcn-targ}.

\begin{align}
L(\theta) = \mathbb{E} \left[ \left((r_t + \gamma \max_{a’} Q_{\theta’}(s_{t+1}, a’)) – Q_{\theta}(s_t, a_t) \right)^2 \right]
\label{loss-fcn-targ}
\end{align}

The difference between Equations \ref{bellman-res} and \ref{loss-fcn-targ} is that Equation \ref{loss-fcn-targ} uses the target Q-network to compute the maximizing action for time $t+1$ rather than the same Q-network as in the latter part of the loss function equation. We update the target Q-network as the main Q-network trains, as in Equation
\ref{target-update}, but it lags behind; $\alpha$ is a small scalar. This lagging target network update can help to stabilize the runaway chasing-one’s-tail effect.

\begin{align}
\phi \leftarrow \phi \left(1 – \alpha\right) + \alpha \theta
\label{target-update}
\end{align}

Another approach to ameliorating the problems of bootstrapping is Inverse Double Q-learning. The $\max_{a’}$ term in the Bellman residual equation (Equation \ref{bellman-res}) is replaced with $Q_{\theta}(s_{t+1}, \underset{a’}{\operatorname{argmax}}~ Q_{\phi}(s_{t+1}, a’))$, where $Q_{\theta}$ is for the “real” network and $Q_{\phi}$ is the target network. Equation \ref{inv-double-q} is the resulting loss function for Inverse Double Q-learning.

\begin{align}
\hspace{-3.25em}L(\theta) = \mathbb{E} \left[ \left((r_t + \gamma Q_{\theta}(s_{t+1}, \underset{a’}{\operatorname{argmax}}~ Q_{\phi}(s_{t+1}, a’))) – Q_{\theta}(s_t, a_t)\right)^2 \right]
\label{inv-double-q}
\end{align}

In this case, we still use the learner network to estimate the Q-value, but rather than picking the action that is maximizing in state $s_{t+1}$ according to the learner network, we use the target network to evaluate the maximizing action.

Yet another approach to ameliorate bootstrapping, Double Deep Q-Networks (DDQN), replaces the $\max$ term in the Bellman residual with $Q_{\phi}(s_{t+1}, \underset{a’}{\operatorname{argmax}}~ Q_{\theta}(s_{t+1}, a’))$, a term that uses the target network (subscript $\phi$) to evaluate the value of a state-action pair and uses the learner network (subscript $\theta$) to evaluate which action is the maximizing action in that state. The resulting loss function for DDQN is given in Equation \ref{ddqn-targ}.

\begin{align}
\hspace{-3.25em}L(\theta) = \mathbb{E} \left[ \left((r_t + \gamma Q_{\phi}(s_{t+1}, \underset{a’}{\operatorname{argmax}}~ Q_{\theta}(s_{t+1}, a’))) – Q_{\theta}(s_t, a_t)\right)^2 \right]
\label{ddqn-targ}
\end{align}

The advantage of DDQN’s approach is that we use a target network, but the action selection is decoupled from between the target and learner networks. In general, DDQN is generally accepted as the current “best” method for ameliorating the effects of bootstrapping. An additional variant on this approach is to use two target networks, evaluate which action to select using both target networks, and choosing the action that gives the lower Q-value.

In general, all of these methods of mitigating the chasing-one’s-tail problem of bootstrapping involve using a target network and decoupling the action selection from the evaluation of the state-action pair’s value in calculating the Bellman residual.

3. Off-policy Learning

In the context of the Deadly Triad, we primarily use the term “Off-policy learning” to refer to RL setups that utilize experience replay during training. Specifically, we utilize data generated using an older version of our Q-function under an $\epsilon$-greedy sampling strategy to improve our current estimate of the Q-function when we operate under it with $\epsilon = 0$. For more detail on on- and off-policy learning, please see the blog post on the subject. Looking at that blog post and what it says about Deep Deterministic Policy Gradients (DDPG), we know that off-policy learning says that $Q_{\theta}(s, a)$ is not a critic of $\pi’
(\cdot | s)$, an arbitrary policy network. Instead, it is a critic of $\pi^*(s) = \underset{a}{\operatorname{argmax}}~Q(s,a)$. The process by which we generate the state-action pairs to train our Q-function can be different from what the critic is evaluating; that is, we decouple sampling/exploration from what the critic is judging. This decoupling is generally considered preferable for sample-efficiency reasons, among others. Off-policy learning, however, is difficult to do well in the context of experience replay.

What is Experience Replay?

In experience replay, we have a database, $D = \{ \langle s_0, a_0, r_0, s_0′ \rangle, \langle s_1, a_1, r_1, s_1′ \rangle, \dots \}$, in which we collect sample experiences from which we train our policy network. These databases, often called replay buffers, are key components of many RL frameworks.

Even though we train from a replay buffer of past experiences, we can modulate the degree to which we train our network off-policy. Q-learning is not technically off-policy, as, when taking the expectation of the Bellman residual, the states from which we compute the expectation must be drawn from somewhere. The distribution from which the states are drawn in computing that expectation should be a uniform distribution over all states, as in Value Iteration, but instead, we draw the state-action pairs from the replay buffer, whih is biased towards some state-action pairs over others based upon our sampling history. The replay buffer is skewed towards the policy used to generate the experiences
within it.

In the paper that inspired this blog post, van Hasselt, et al. explore prioritizing the experiences in their agent’s replay buffer by setting the probability of sampling a specific point $p_i$ from the replay buffer to be proportional to the error—the Bellman residual. That is, they rank the samples in the replay buffer according to how wrong the function approximator is when evaluating them and then train the Q-function to prioritize selecting points that are ranked as being more incorrect so that the learner can fix its evaluation of the Q-value estimate of those experiences. While this approach seems reasonable—a human who is very unskilled at a specific task who practices that task is sure to learn to improve their performance of that task, even if only a little—it actually increases the likelihood of the Q-network diverging when compared to training the Q-network on uniformly-sampled experiences. The takeaway here is that, while prioritizing specific examples in a replay buffer is an interesting area of research, if we just want our learner to learn, sampling non-uniformly from our replay buffer could make things worse. An additional divergence risk is the size of the neural network itself. In general, for DQN, the risk of the function approximator diverging increases as the network size increases. Conversely, for DDQN, the risk of the network diverging is agnostic of network size.

Conclusions

DQN and its variants are frequently used because, not only are they widely applicable, but they work in a lot of scenarios. The Deadly Triad—function approximation, bootstrapping, and off-policy learning— can all cause complications in the application of DQN, however; in this blog post, we covered these challenges and common approaches to handling them. The main takeaways from this blog post are:

  1. Function approximation does not have the same nice guarantees that tabular learning has, but it is far more flexible when the state and/or action spaces are large.
  2. To ameliorate the instability bootstrapping can cause, consider either using a multi-step update in the Bellman residual or using DDQN.
  3. When using a replay buffer, sample from the replay buffer uniformly—don’t try to prioritize any experiences over others

Many thanks to Ruisen “Eric” Liu for editing this blog post and providing suggestions for how to improve it.

References

  1. Mnih, Volodymyr, et al.“Playing Atari With Deep Reinforcement Learning.” arXiv preprint arXiv:1312.5602 (2013).
  2. van Hasselt, Hado, et al. Deep Reinforcement Learning and the Deadly Triad. arXiv preprint arXiv:1812.02648 (2018).
  3. R. S. Sutton and A. G. Barto. Reinforcement Learning: An Introduction, 2nd ed. The MIT Press, Cambridge MA, 2018.
  4. Lillicrap, Timothy P., et al.Continuous Control With Deep Reinforcement LearningInternational Conference on Learning Representations, Sep. 2016.

Filed Under: Bootcamp

Bootcamp Summer 2020 Week 4 – On-Policy vs Off-Policy Reinforcement Learning

February 28, 2022 by mschrum3 and Matthew Gombolay


Reinforcement learning algorithms can be divided into two main types: on-policy and off-policy. Understanding the differences between on-policy and off-policy learning is essential to understanding and implementing various reinforcement learning algorithms. Below we will discuss the key differences in on-policy and off-policy learning, the algorithms that employ these two different approaches, and the implications of these learning approaches.

  1. What is on-policy versus off-policy?
  2.  Examples of on-policy and off-policy algorithms
  3. Implications
  4. Advantages and Disadvantages
  5. Takeaways
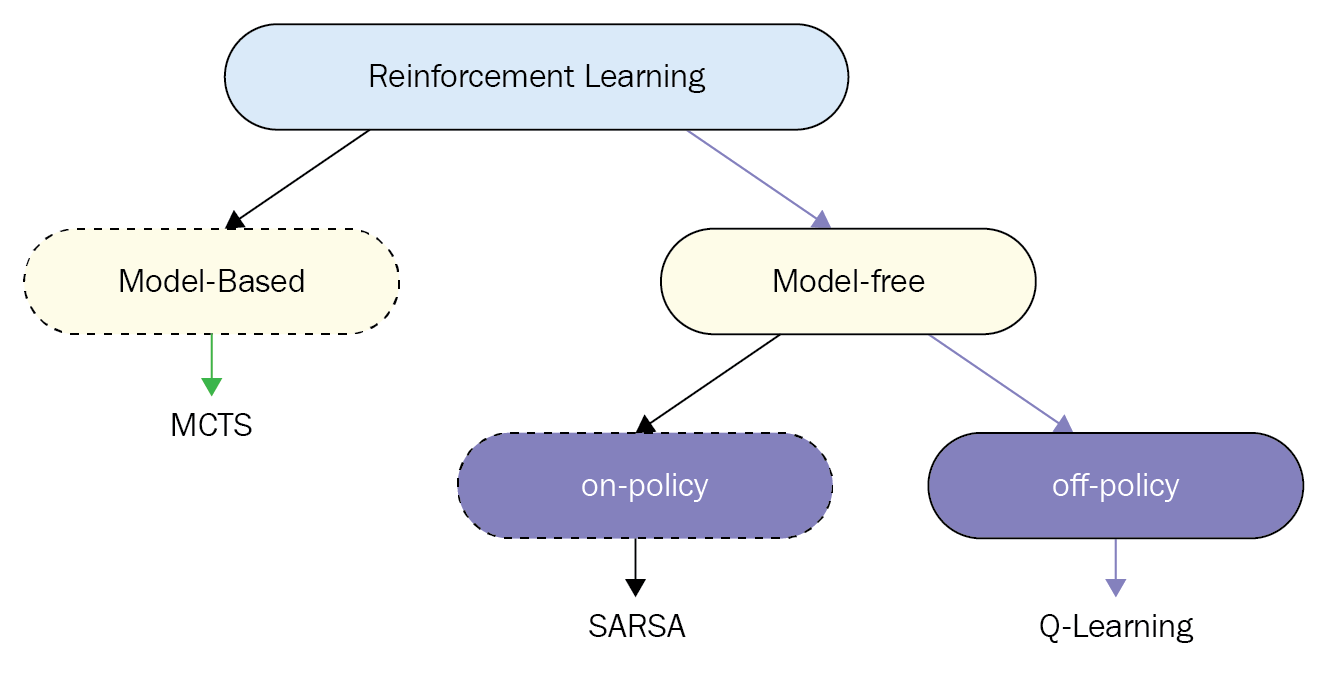
Break-down of types of reinforcement learning algorithms.


1. What is on-policy versus off-policy?

On-policy and off-policy learning fall under the category of model-free reinforcement learning algorithms, meaning that we do not have access to the transition probability distribution. This is opposed to model-based methods such as Monte-Carlo Tree Search (MCTS).

To begin our discussion of on-policy and off-policy reinforcement learning, we will first introduce some terminology. In a reinforcement learning setting, an agent interacts with an environment, moving from state, $s$, to $s’$ via action, $a$, and transition probability, $T(s,a,s’)$. The agent’s policy, $\pi(s)$ dictates the action that an agent takes in state, $s$. The objective of reinforcement learning is to find the optimal policy, $\pi^*$, which maximizes future discounted expected reward. The Q-function, $Q(s,a)$, describes the value of a state action pair. If we know the optimal Q-function, $Q^*$, which describes the maximum expected reward of any given state-action pair, then we can extract the optimal policy according to Eq. 2.

\begin{equation}
Q^*=R(s,a)+\gamma \mathop{\mathbb{E}}_{s’}[V^*(s’)]
\end{equation}

\begin{equation}
\pi^*(s)=argmax_{a}Q^{*}(s,a) \quad \forall s
\end{equation}


To understand the difference between on-policy learning and off-policy learning one must first understand the difference between the behavior policy (i.e., sampling policy) and the update policy.

Behavior Policy: The behavior policy is the policy an agent follows when choosing which action to take in the environment at each time step. In Q-learning, our behavior policy is typically an $\epsilon$-greedy strategy. In an $\epsilon$-greedy behavior policy, an agent chooses the action dictated by the current policy, $\pi(s)$, with probability 1-$\epsilon$ and a random action with probability $\epsilon$. The behavior policy generates actions and determines how the agent interacts with the environment.

Update Policy: The update policy is central to understanding the difference between on-policy and off-policy learning. The update policy is how the agent updates the Q-function. In other words, it dictates how the agent derives the state-action pairs which are used to calculate the difference between the actual Q-value and current predicted Q-value, also known as the TD-error. The TD-error is then used to update the Q-function.

This brings us to the key difference between on-policy and off-policy learning: On-policy algorithms attempt to improve upon the current behavior policy that is used to make decisions and therefore these algorithms learn the value of the policy carried out by the agent, $Q^{\pi}$. Off-policy algorithms learn the value of the optimal policy, $Q^*$, and can improve upon a policy that is different from the behavior policy.  Determining if the update and behavior policy are the same or different can give us insight into whether or not the algorithm is on-policy or off-policy. If the update policy and the behavior policy are the same, then this suggest but does not guarantee that the learning method is on-policy. If they are different, this suggests that the learning method is off-policy.

Let’s take a look at some examples.

2. Examples

Here we discuss several examples of on-policy versus off-policy algorithms and highlight the key differences between them. The important lines in each algorithm are shown in red.

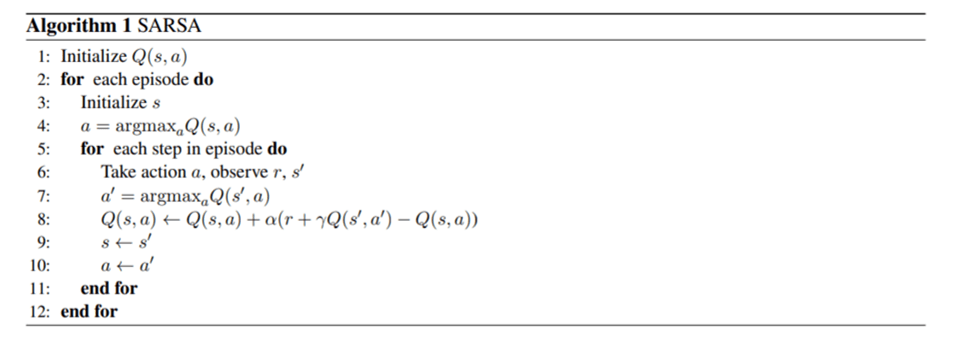
Below is the pseudo-code for SARSA (State, Action, Reward, State, Action), an on-policy algorithm.

SARSA often utilizes an $\epsilon$-greedy behavior policy and follows the same policy when updating the Q-function, meaning that $a’$ is also selected based upon an $\epsilon$-greedy strategy as shown in Line 7. Thus, because SARSA learns the quality of the behavior policy rather than the quality of the optimal policy, SARSA is an on-policy algorithm.

Below is the pseudo-code for Q-learning.

The key difference between Q-learning and SARSA is the
$max_{a’} Q(s’,a’)$ term found in the Q-learning algorithm. This $\max$ term means that Q-learning is learning the value of the optimal policy. SARSA’s Q-function models the q-values of the behavior policy whereas Q-learning learns the optimal q-values. This distinction is what makes SARSA on-policy and Q-learning off-policy.

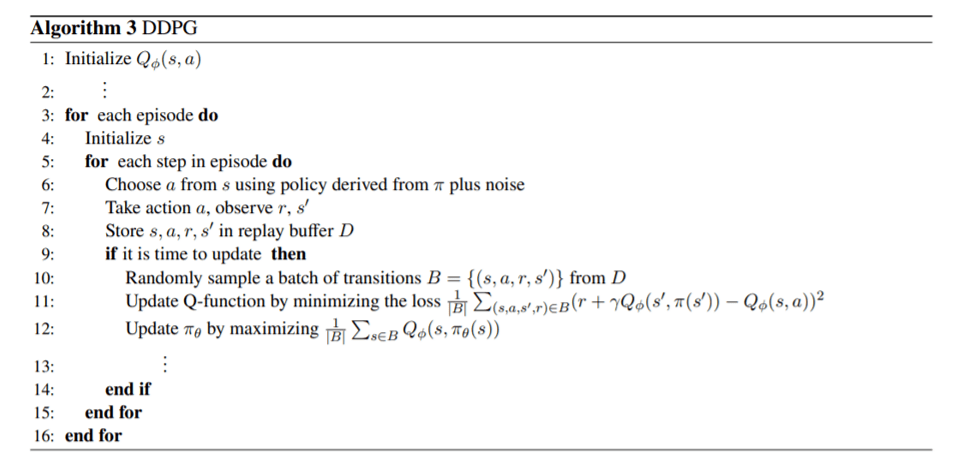
Let’s take a look at another algorithm, Deep Deterministic Policy Gradient (DDPG). DDPG is an actor-critic method. This means that it concurrently learns both a policy as represented by the actor and the Q-function as represented by the critic. DDPG also utilizes experience replay in which it stores state-action-state-reward tuples in a buffer and samples these examples during training. We focus on the part of DDPG that is relevant to our on-policy versus off-policy discussion. Below is a subsection of the pseudocode. $\pi_{\theta}$ describes the policy the agent is learning parameterized by $\theta$ and the Q-function is parameterized by $\phi$.

We see in Line 6 that DDPG utilizes a stochastic behavior policy defined by the actor $\pi$ plus exploration noise. What about the update policy? The update policy is shown in Line 11. Unlike in Q-learning, there is no max when selecting the next action in Line 11. Instead we see that we are using the actor $\pi_{\theta}$ to selection $a’$ which sounds like DDPG is optimizing its current policy and therefore is an on-policy algorithm. So does this mean that, because DDPG is updating the Q-function via $Q_{\phi}(s’,\pi_{\theta}(s’))$ instead of $\max_{a’}$ $Q_{\phi}(s’,a’)$, that DDPG is on-policy? No! Based on our definition, an on-policy algorithm improves upon the current policy, whereas an off-policy algorithm learns the value of the optimal policy. With DDPG, as time goes to infinity, the actor selects the action which maximizes the Q-function as shown in Line 12. Because at convergence, $\pi_{\theta}$ is optimal and therefore $Q_{\phi}(s’,\pi_{\theta}(s’))=\max_{a’}$ $Q_{\phi}(s’,a’)$, DDPG is evaluating the optimal policy, making it an off-policy algorithm.
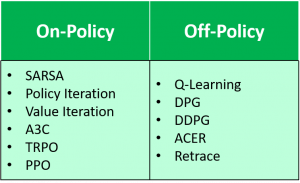
To the right is a list of other common on-policy and off-policy algorithms. The same analysis of the behavior policy and the update policy can be used to verify the type of learning that each of these algorithms employs.

3. Implications

So what are the implications of these differences? In the end does the type of learning matter? When should we use which algorithm?

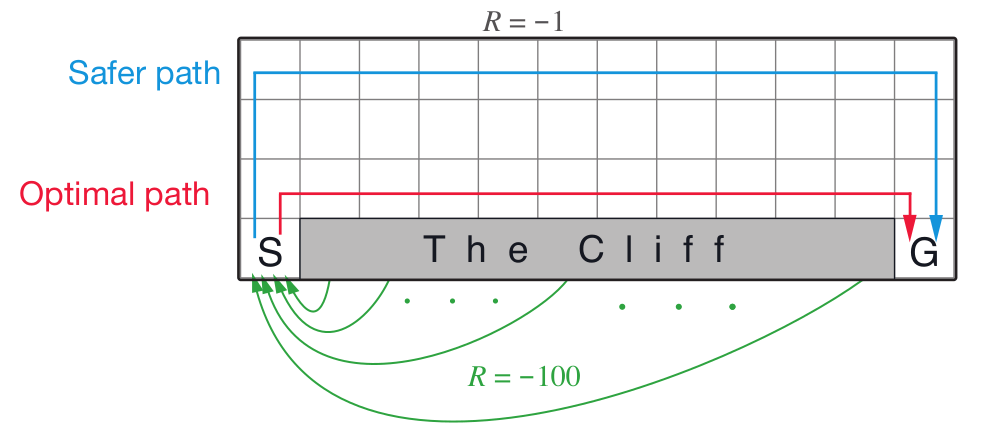
This figure depicts the cliff walking domain. The SARSA agent learns the safer path shown in blue and the Q-learning agent learns the optimal path shown in red [1].

Different Policy Outcomes: First of all, these different training methods can result in different behaviors due to the fact that on-policy methods learn $Q^\pi$ and off-policy methods learn $Q^*$. For example, in Q-learning because the update policy follows a greedy policy, it assumes that the agent will act optimally in the future and therefore, Q-learning will learn the optimal policy as long as all states and actions are sufficiently experienced. As shown in the above figure, this means that the cliff walking agent will learn to take the optimal path from the start to goal even though this path may be dangerous if the agent’s actions are stochastic.

SARSA, on the other hand, assumes that the agent will follow the current policy in the future. This means that when updating the Q-function, we assume that the cliff walking agent will at times jump over the cliff if it travels too close to the edge. Therefore, SARSA learns a policy which is safer and ensures that the agent will avoid the cliff. SARSA only learns a near-optimal policy that depends on the behavior strategy. For example, if the behavior strategy is $\epsilon$-greedy then SARSA will learn at optimal $\epsilon$-greedy strategy. To more closely approximate the optimal policy, one can decay $\epsilon$ to decrease exploration over time. SARSA is guaranteed to converge to the optimal policy if the behavior policy converges to a greedy policy and all states and actions are visited an infinite number of times.


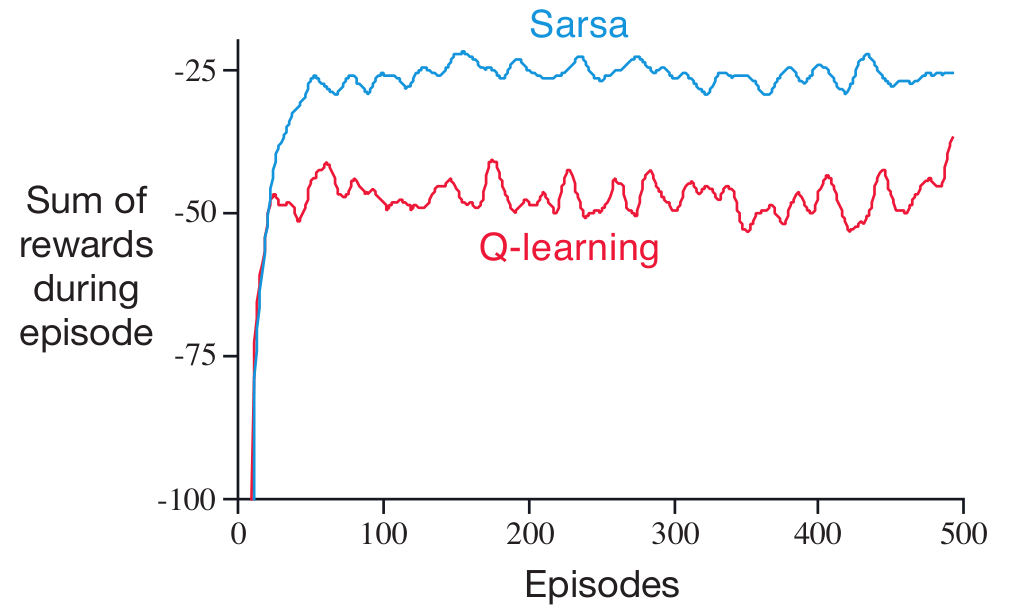
This figure shows the rewards received by an agent trained via SARSA and an agent trained via Q-learning in the cliff walking domain. In this domain, SARSA achieves higher rewards than Q-learning despite learning a sub-optimal policy [1].

Although Q-learning learns the optimal strategy, SARSA may have better online performance. As shown in the plot, SARSA obtains higher episodic rewards on average than Q-learning in the cliff domain due to the fact that the agent takes a safer route. However, this may not be the case for all domains.

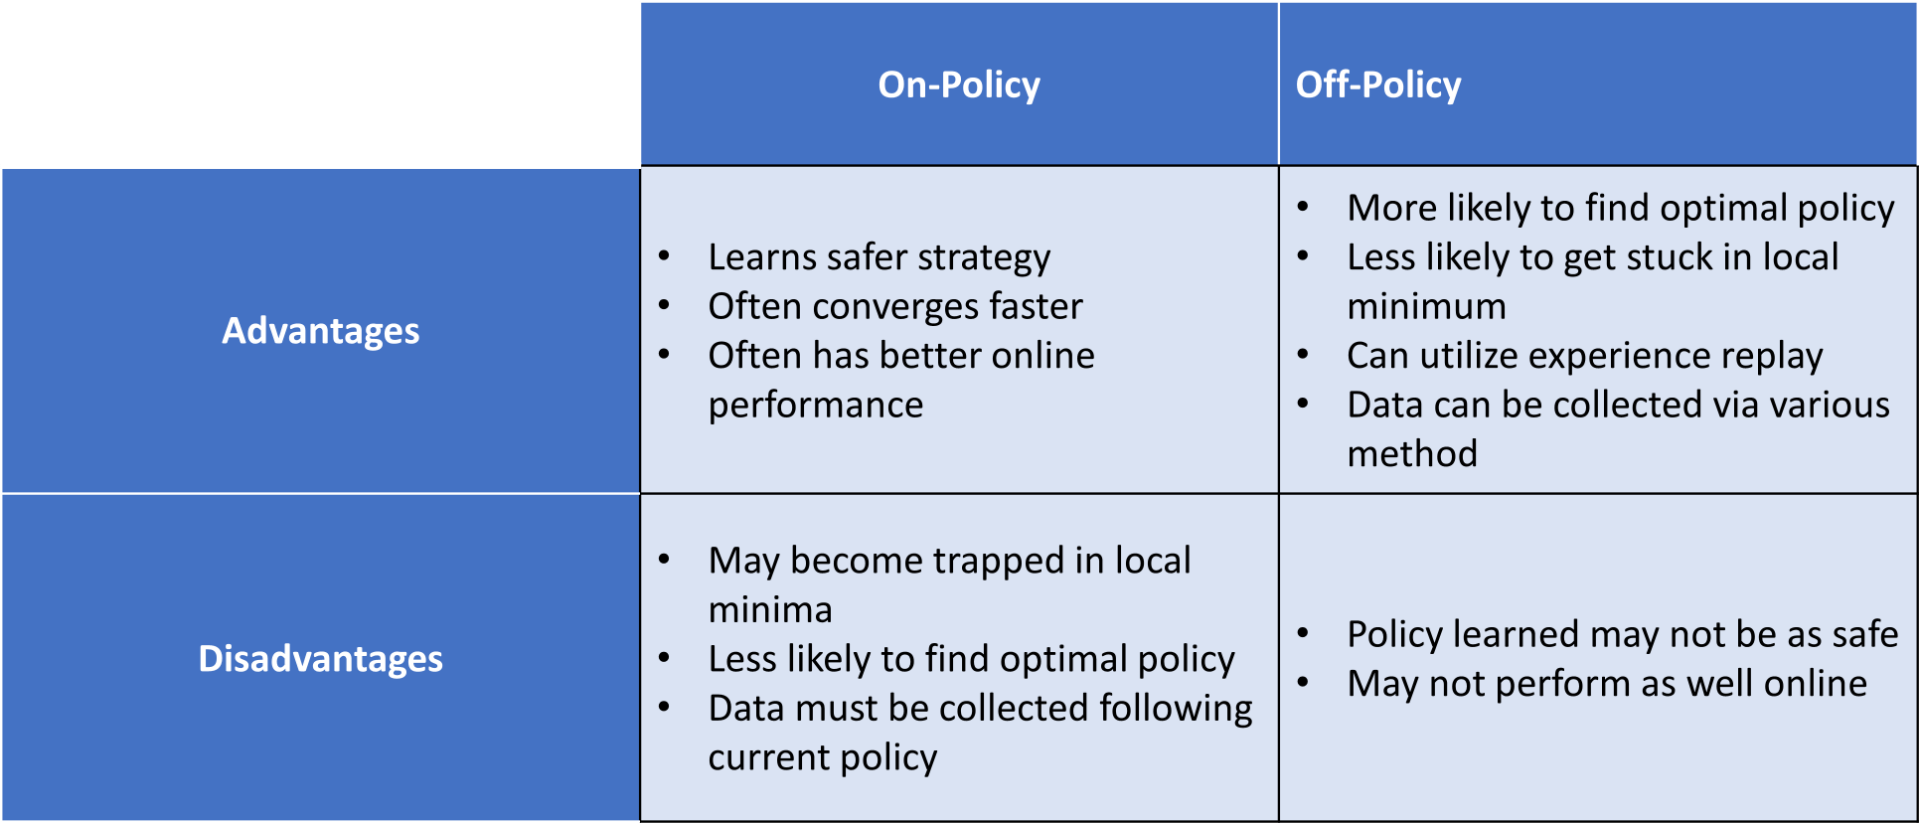
When to employ which learning strategy: If, for example, one is utilizing reinforcement learning to train a physical robot then one may opt for a more conservative and safer learning scheme such as the on-policy SARSA. SARSA also tends to be more stable while training. However, if training in simulation, Q-learning may be more effective since it is more likely to learn the optimal policy and less likely to become trapped in a local minimum. Additionally, off-policy algorithms can take advantage of experience replay when the behavior policy is changing or even if the behavior policy is generated from a source other than the learning agent (e.g., a human demonstrator). On-policy algorithms can only utilize experience replay when the behavior policy is static. Experience replay allows us to utilize historical data when learning which can help de-correlate training examples and is useful when gathering experience is costly. Additionally, off-policy learning is agnostic to how the data is generated and can therefore utilize data generated from other sources. Consequently, off-policy learning may be preferable in situations in which the data must be generated in a way that does not follow the current policy, for example, via human demonstrations.

4. Advantages and Disadvantages

5. Takeaways

  1. To identify if a reinforcement learning algorithm is off-policy or on-policy, one must first identify the behavior policy and the update policy. If the algorithm attempts to improve the behavior policy, it is on-policy. If however, the algorithm learns the optimal policy, then it is off-policy.
  2. SARSA is an example of on-policy learning and Q-learning is an example of off-policy learning. Algorithms such as DDPG, which learn the quality of the optimal policy, are off-policy strategies.
  3. The strategies that results from on-policy learning versus off-policy learning can differ in a number of ways including how safe the policy is, its convergence guarantees, and the online performance.

References
[1] Richard S. Sutton and Andrew G. Barto. Reinforcement Learning: An Introduction. The MIT Press, second edition, 2018.


Filed Under: Bootcamp

  • Page 1
  • Page 2
  • Page 3
  • Next Page »

Primary Sidebar

Secondary Sidebar

People

  • Matthew Gombolay
  • Sanne van Waveren
  • Matthew Luebbers
  • Manisha Natarajan
  • Zac Chen
  • Nina Moorman
  • Zulfiqar Zaidi
  • Zixuan Wu
  • Kamel Alrashedy
  • Zhaoxin Li
  • Arthur Scaquetti
  • Kin Man Lee
  • Qingyu Xiao
  • Batuhan Altundas
  • Julianna Schalkwyk
  • Minwoo Cho
  • Varshith Sreeramdass
  • Polina Zhang

Copyright © 2025 · eleven40 Pro on Genesis Framework · WordPress · Log in